 Before continuing my series of articles about trading Supply and Demand, I thought that it could be useful to take a break and focus a bit on what candle pattern. Because this candlestick patterns are one of the most important parameters on making decision. At the last, candlestick patterns are the key of risk management variable. We have to consider that there is several other factors on this trading on simplicity (but not so many, stay calm, this is the real deal). We can use it on m30 time frame for intraday trading. We will see some example charts from this simplicity supply demand trading strategy. And remembering in apply money management.So let’s get to the bottom of it.
WHAT DO YOU HAVE TO ASK YOURSELF?
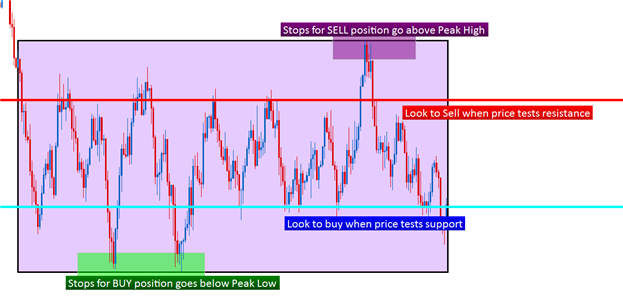
1) Where is price likely to turn? Supply and Demand areas.
2) What can tell us if price is turning? CANDLES.
3) Where is price likely to go next? The opposite areas of Supply and Demand.
That’s it, you know everything there is to know. Good luck!
More seriously though, if you manage to convince yourself that you DO NOT need much more to succeed in trading, you have done half the way. The other half is only discipline and a proper money management.
THE SUPPLY AND DEMAND AREAS
So, how to identify the good areas? If you never used pure supply and demand zones to trade, and were focusing on Harry Potter’s dragon-shaped moving averages clouds, you will probably have a hard time to identify the zones, because it would be way too simple for you to see.
So you will probably need the supply demand indicator mt4, based on Zig Zag, which spots and draws for you the supply and demand zones of interest. It is nothing more than a small indicator that shows you where price turned in the past. Simple, yes, but the most important thing we need to know. Because those are areas where the big guys decided to buy or sell and are likely to do so again when price comes back. Then, if you want to filter your zones, watch precisely how price left the zone: big bold candle? Several small candles building a base? Etc etc etc… Then backtest and see how the best zones are created. We cannot do everything for you, take it as a gift for your future success. Only hard work will take you there, remember.
SHOULD I TRADE ON WILD GUESSES?
While If my ante and I love to pick top and bottoms (something to do with a hatred of drawdown and a flattery of our egos), it is not something we recommend. Because if you are not experienced enough, you will suffer a lot from it. And experience taught me that in the end, you are less stressed with less precise entries but a better money management. Our best asset is that we know that most of the time, when price decides to turn, it will always come back to test the newly created area and pick up new orders that will help the price move faster, for good.
The conclusion of this paragraph is that you do not need to enter at the perfect pixel, you need to know if the area will hold and have enough strength to make price turn. So consider yourself lucky enough that price is coming back for you. The precision does not matter.
WHAT IS THE BETTER TIME FRAME?
Now, we have our zones drawn on our chart. People often ask me: what is the better time frame? Well, there is no answer to that, and this question is quite dumb really. Supply and Demand is an universal law, OK? So it works on M1 and on weekly. The rest depends on what type of trading you want to do. If you want to have some free time like Ken, you go for H4 and Daily. If you like the thrill too much and have a lot of time to devote to trading, you go M5-M15. If you like taking a couple of trades every two days, you go M30-H1. Simple.
For the purpose of this article, let’s go with M30, hoping it will satisfy everybody.
SO WHATS OUR MISSION?
Your mission is very simple:
1) Wait for a new zone to be created (imbalance of supply and demand)
2) Watch price action to see if the professionals (with all their big money) will read the new zone as a signal to take the trade or not. The candle patterns become the most important thing at this point (read articles about candlestick reversal patterns).
3) Enter with confirmation of price action ( bear candle(s) at supply / bull candle(s) at demand)
4) Exit the trade when happy with gains or wait for the opposite zone of supply/demand and trail your stop.
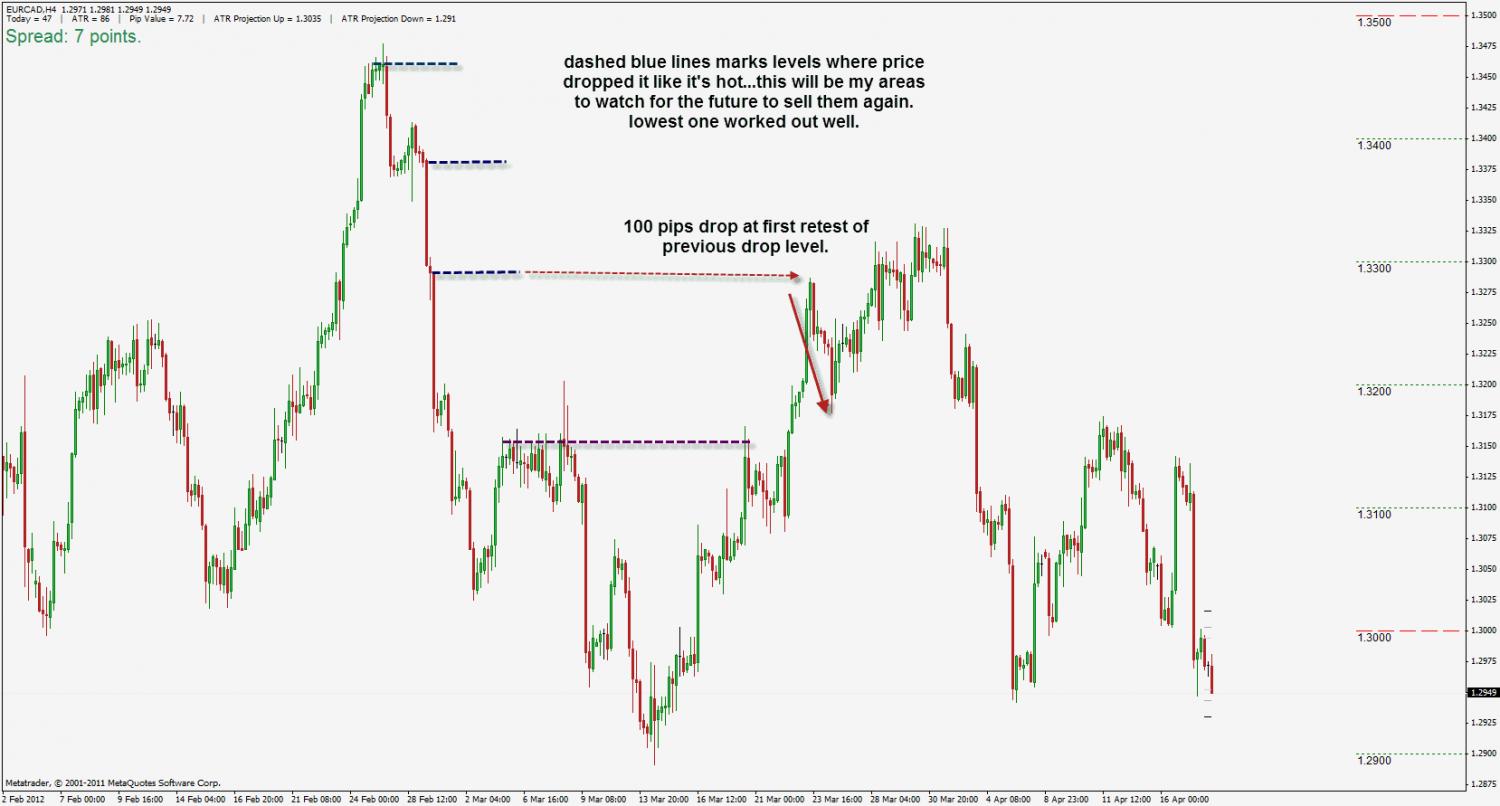
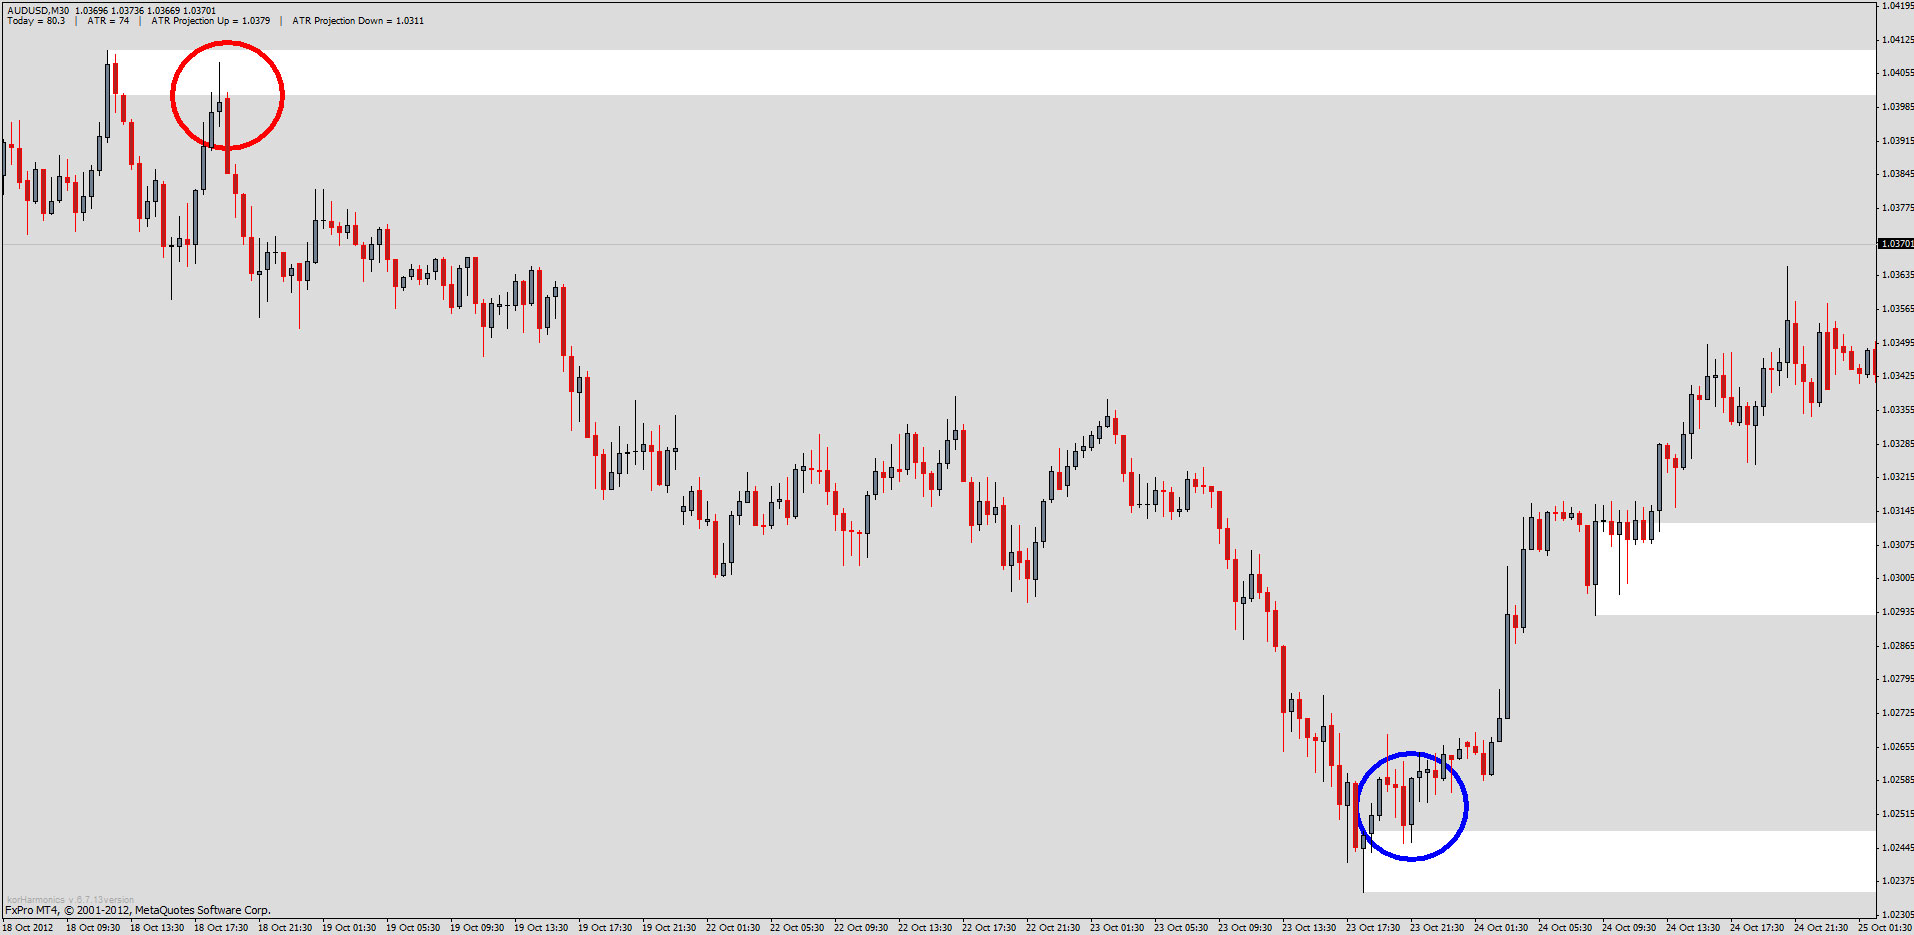
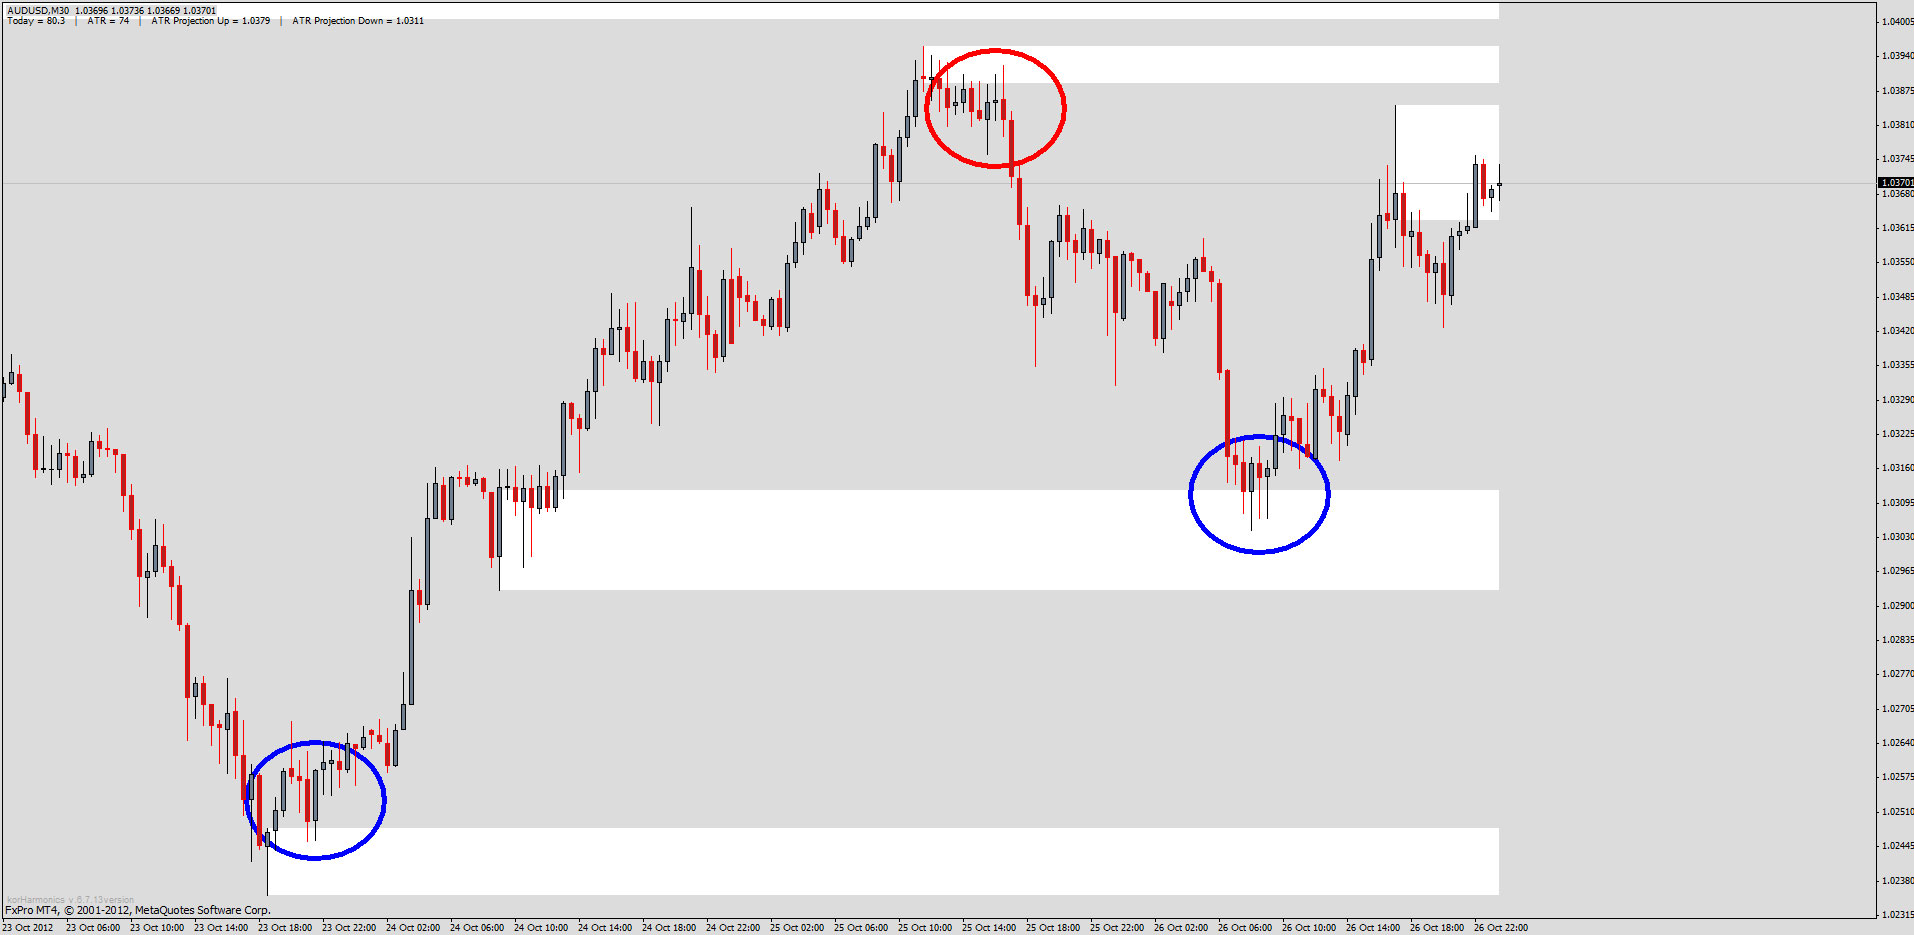
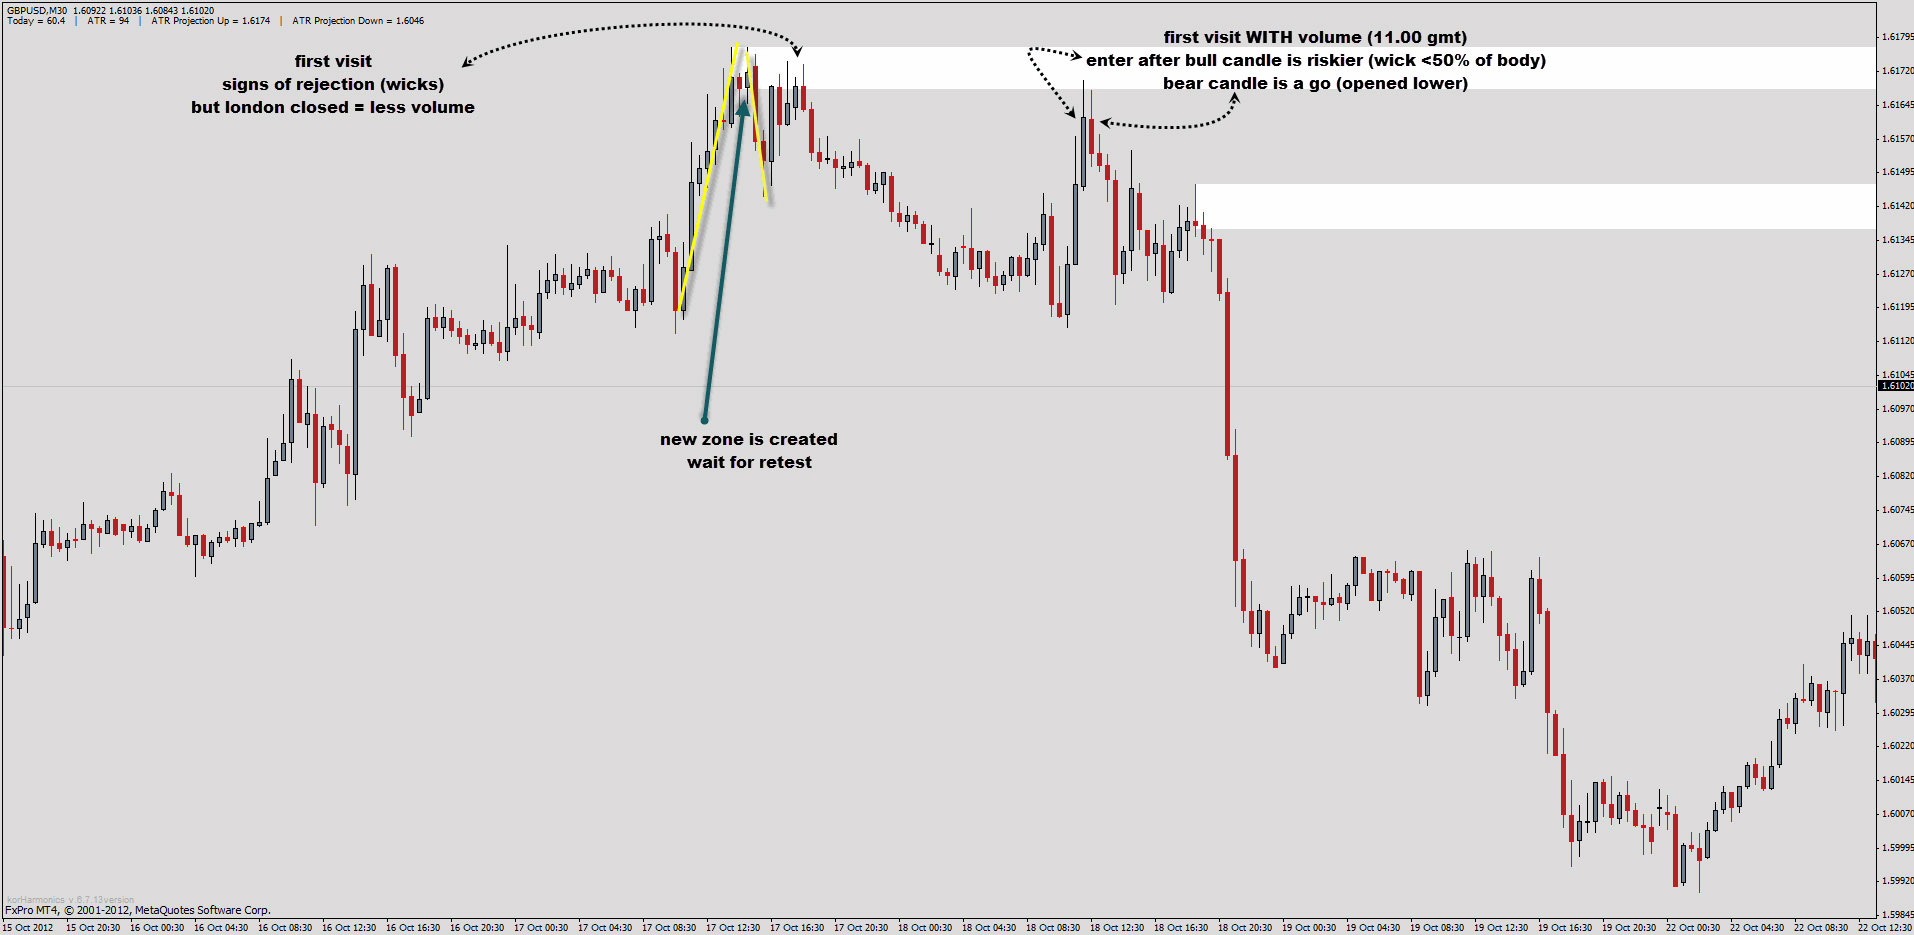
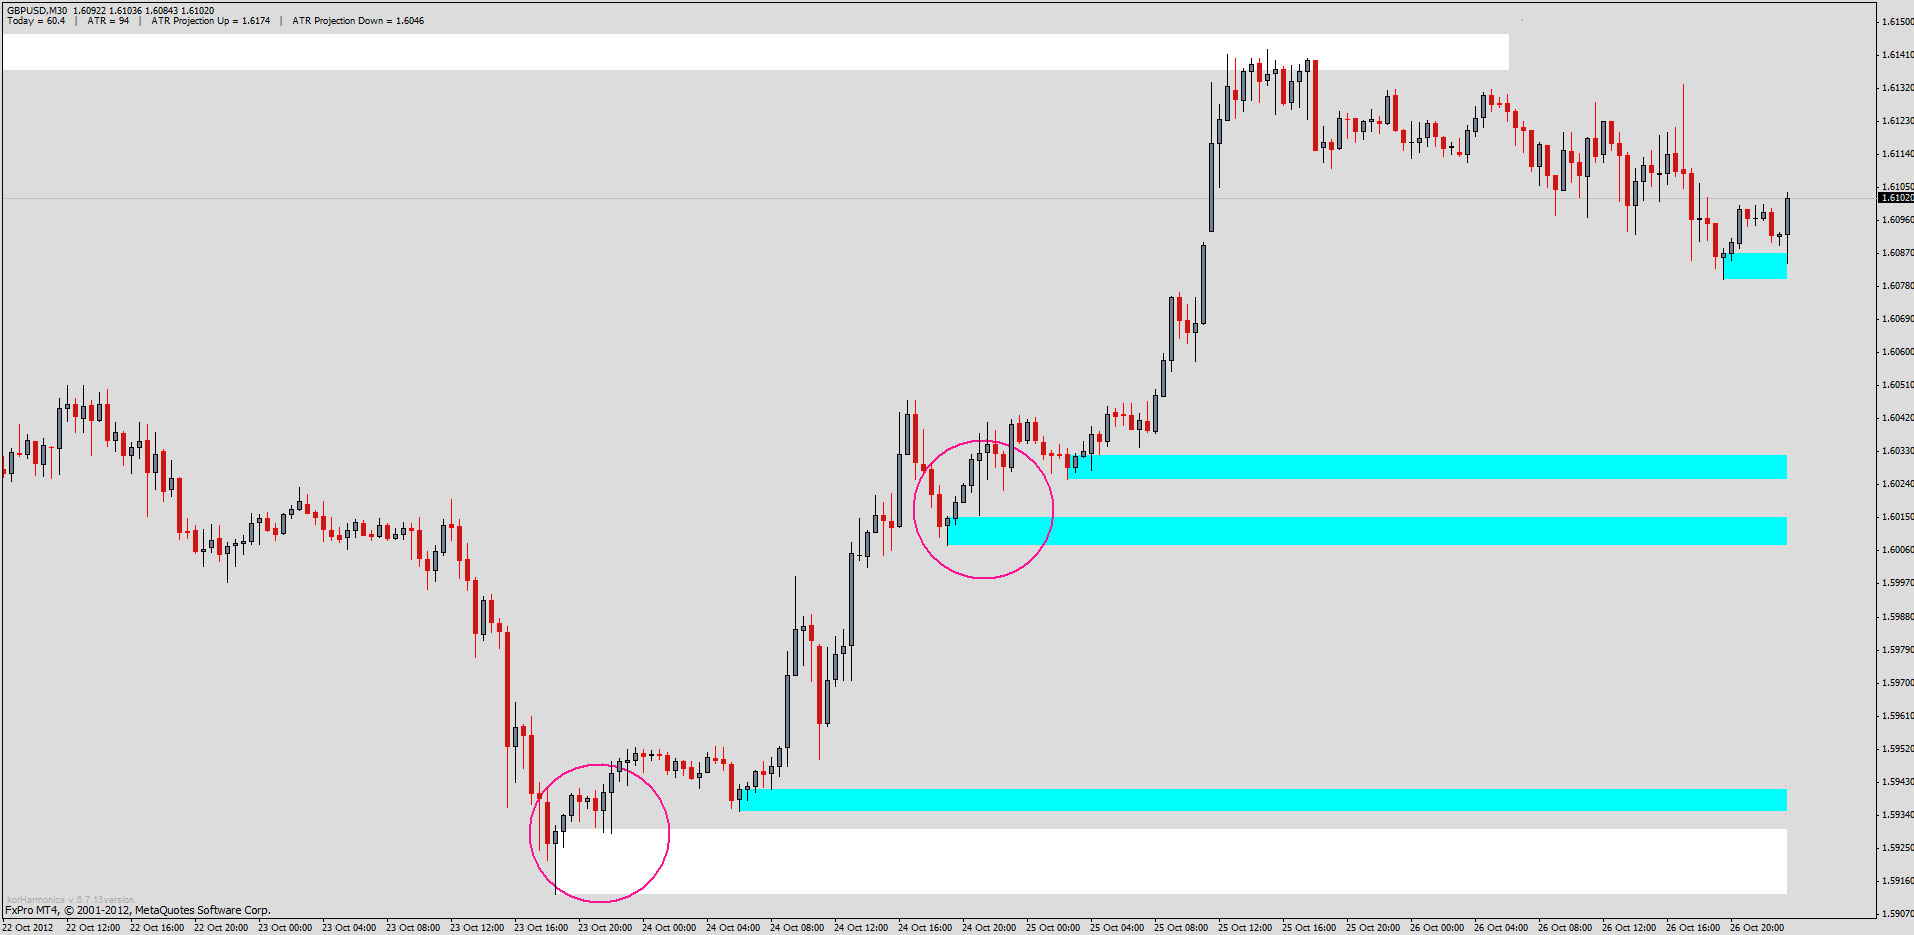
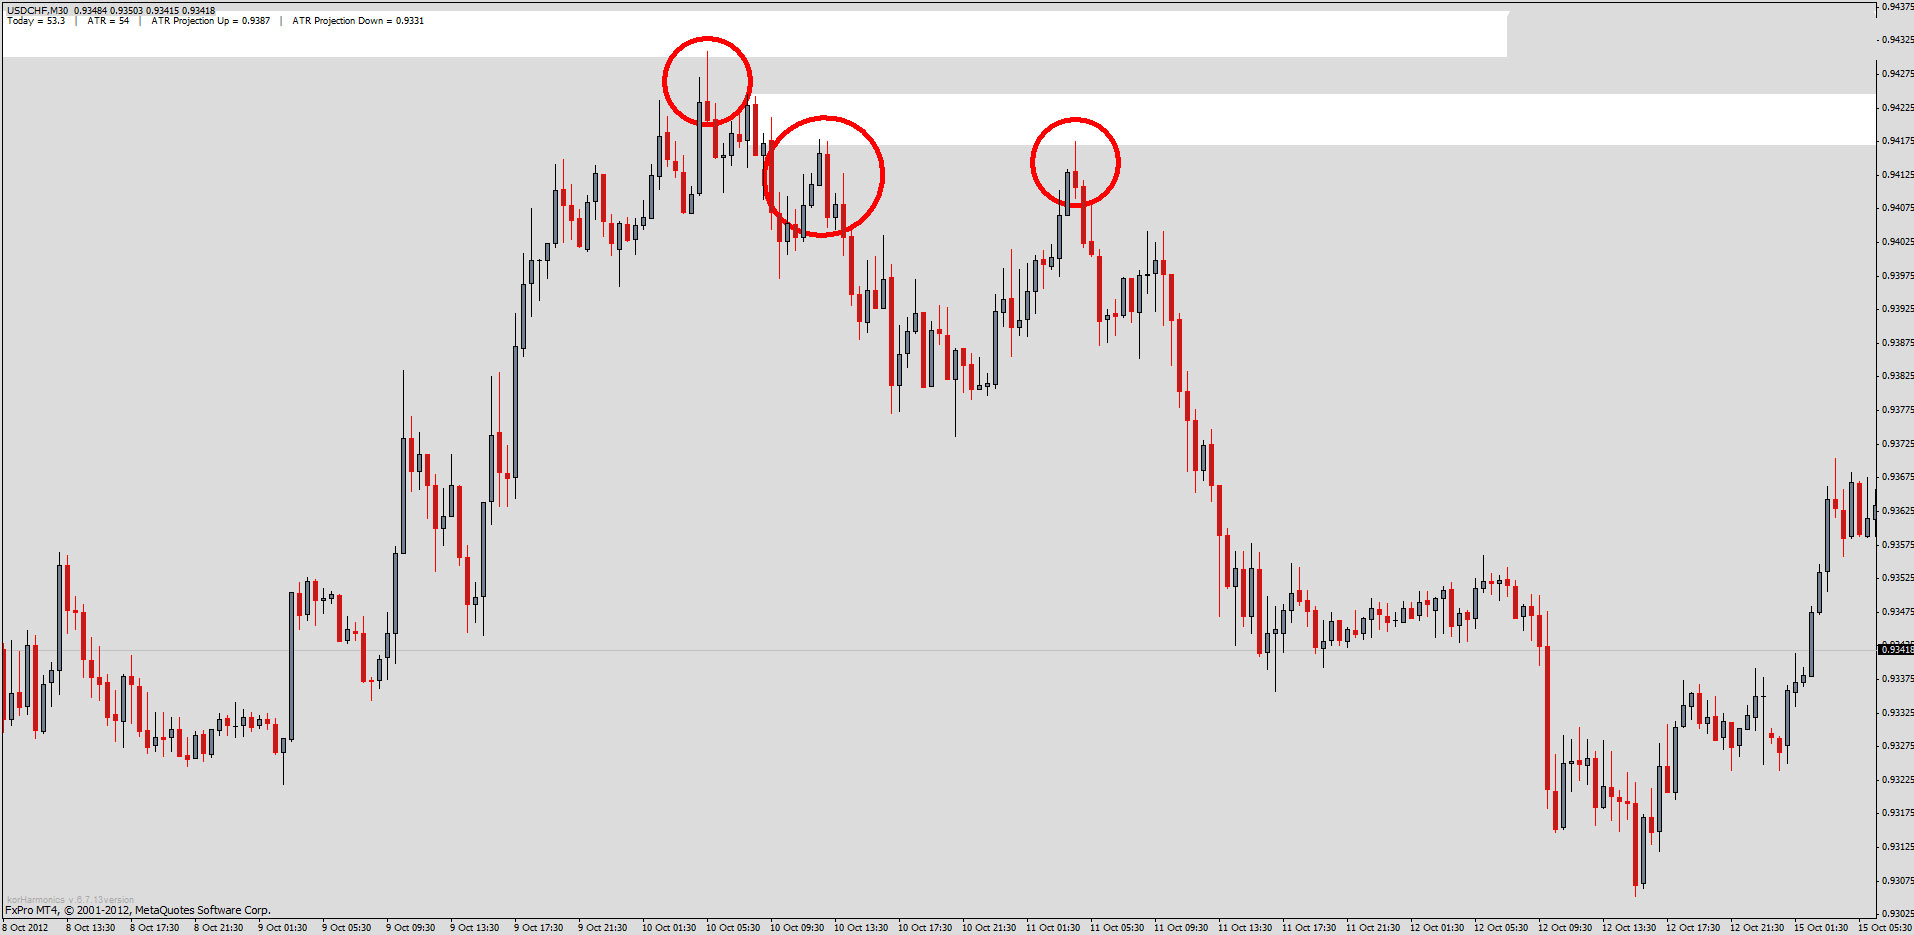
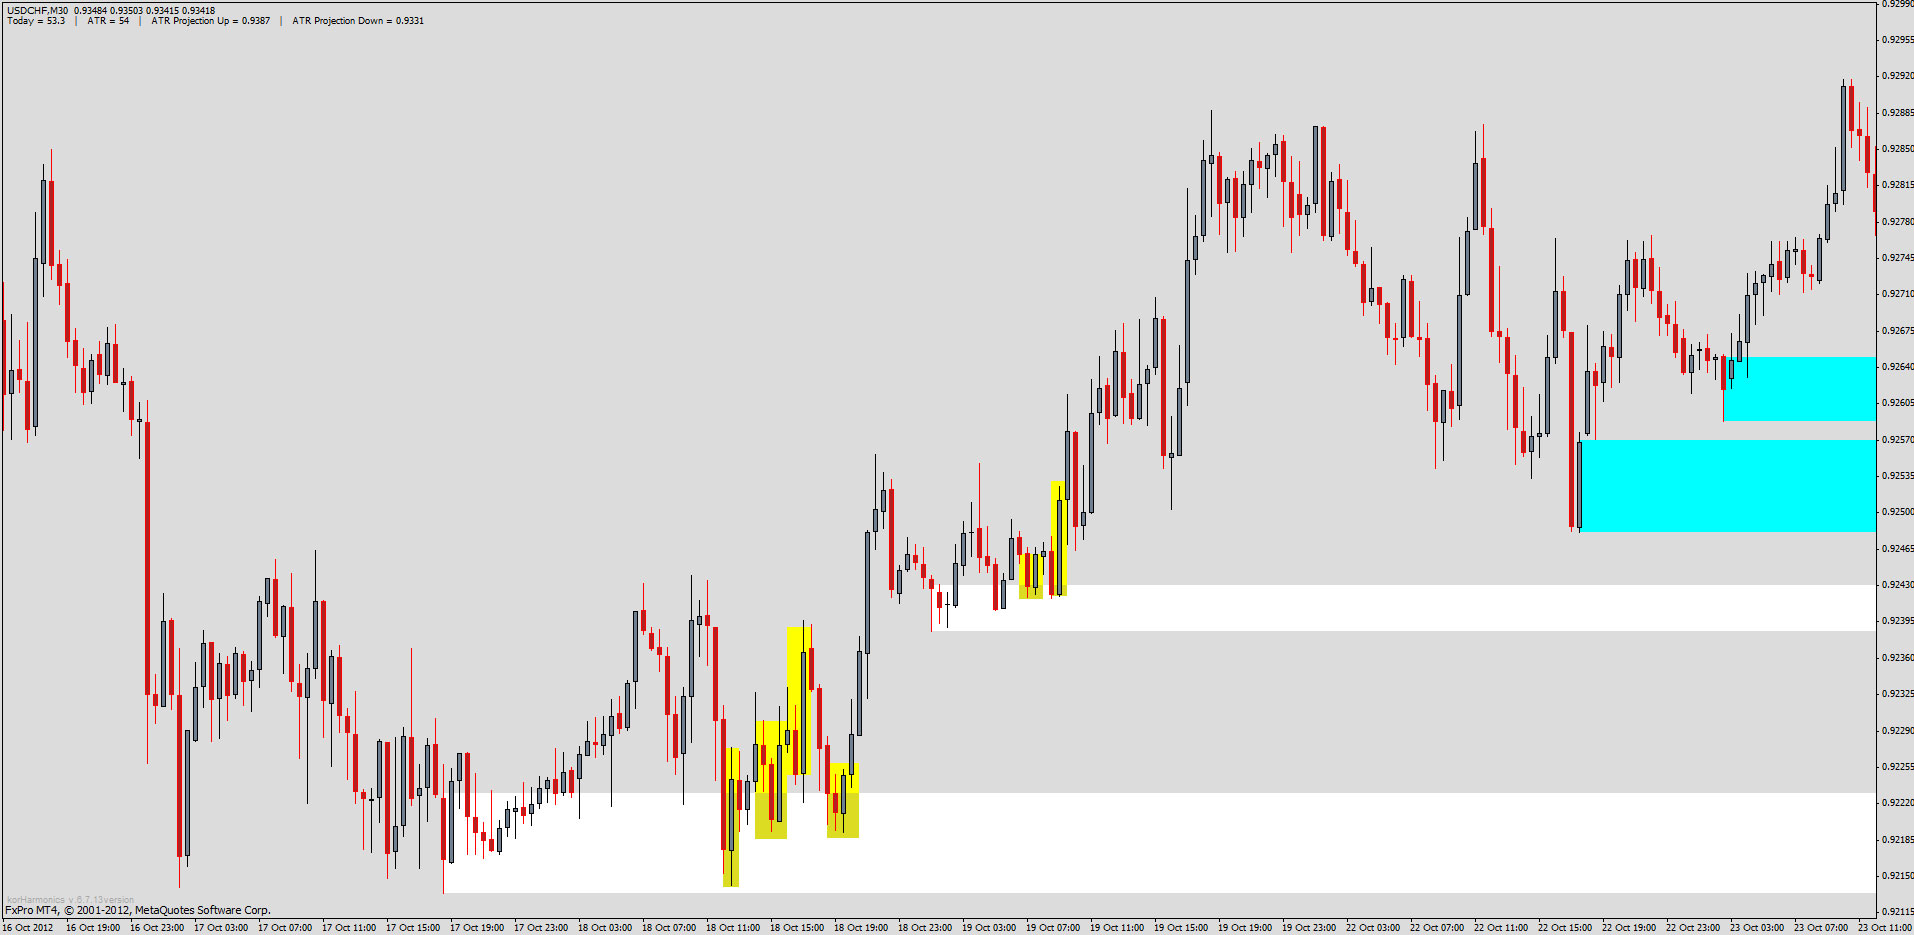
OK, enough chit-chat. Have a look at the charts below. I explained the reasoning on the first ones. I just marked the other ones with circles and yellow rectangles to underline the important price action that gets you into the trades.
Then your next missions are :
- spend some time observing live which zones hold and which don’t.
- study the importance of the different sessions (Asia, London, New York)
- learn how to use the dollar index as your best indicator
- if you want, you can add one or two ingredients to fine tune your edge: Fibonacci retracements / projections, trend lines, etc… Just make sure to not overload your charts so that you can still see what matters most: PRICE ACTION.
I hope it was helpful. ![]()
SEE SOME EXAMPLE FROM M30 TIME FRAME CHARTS BELOW :
AUDUSD M30 TIME FRAME
EURUSD M30 TIME FRAME
GBPUSD M30 TIME FRAME
USDCHF M30 TIME FRAME
Happy practice with this simplicity supply demand trading strategy and if you want read some great e-book from this core supply demand trading system. Again supply demand forex trading need to be filtered with reversal candlestick patterns, and if there is 2 or more reversal candlestick patterns in one range zone that can be read as supply demand area and combined this forex trading strategy with multi time frame analysis, it mean identify strong support resistance zone based from supply demand area from bigger time frame and looking best signals trading open positions in smallest time frame.
