Let Candlestick Tells On Us About The Price
 From our experience in trading forex, this candlestick patterns cannot be forget from our variable analysis. This forex candlestick basics can be read on best time frame at least on four hour time frame. Why have to read on four hour timeframe ? because this four hour time frame give us the best parameter to get strong support resistance zones or even better read based on daily time frame so it will get a accurate trading signals to enter the market which still have to be filtered by candlestick pattern from daily time frame. So, to read strong support resistance or strong level entry have to be done from D1 timeframe and looking the best momentum on H1-H4 timeframe. This is exactly what we do on every our analysis before made some open position.
If you understand this knowledge about candlestick basics, i am really sure that we can take control the risk.
Here the details below about candlestick basics that we must learn and understand, because this is one of the key to read market psychology.
How candles are formed. Anatomy of candlesticks. Lets the pictures do the explain.
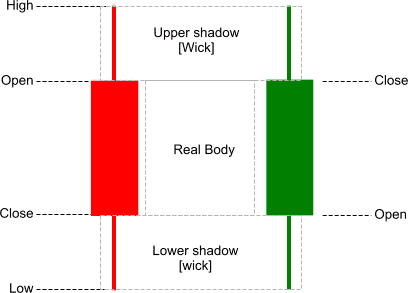
As in everything in this life, not all candles come in same shapes and sizes. It’s a good idea to familiarize ourselves with some noticeable ones.
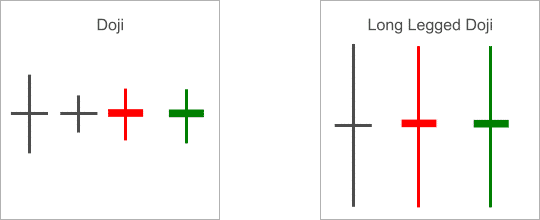
Doji: When opening and closing prices are almost the same we have a doji candle. However, as you can see on above Doji candles opening and closing prices npt always may be virtually the same. On the other hand wick [shadow] length can be at different sizes on different occasions. Doji tells us there are some dog fight is going on the market. Neither buyers or sellers were able to take charge, as a result we end up in bit of uncertainty. Indecision. However, we can decide on making a coffee for ourselves while PA resolves itself.
Long Legged Doji: Same as above but it tells us dog fight is much more bigger. I really don’t like messing around with big dogs.
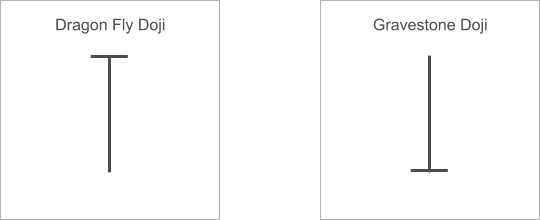
Dragon Fly Doji: Opening and closing prices are highest of the candle. Opens high, travels south then comes back to opening price to close. Looks just like alphabet T, long lower shadow and no upper one. We see that from the open, sellers were in charge but when they hit the bigger buyers, price has been pushed back to where sellers started. It could be useful when it appears on a decent demand zone.. In my trading candlesticks and candlestick patterns carries any weight, when they appear on a decent buyers or sellers zones.. So for me, first levels then Price Action.. Why? Because those levels where the noticeable sellers and buyers lives. However, we don’t know how decent they are, so we wait for the Price Action to tell us.
Gravestone Doji: Opposite of Dragon fly doji. The name gives some hints about the possible Price Action.
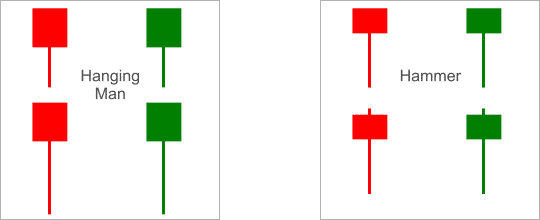
Hanging Man: Bear or Bull candle with small body near the high with a little or no upper shadow but long lower shadow. The lower shadow should be 2 or 3 times of the height of the body. It’s considered bearish pattern during up-trend, as it indicates that buyers are running out of steam. However, it doesn’t mean for sure that buyers lost the control. It shows momentum decreasing and direction or price may be getting near to change. Just an early possible sign. (ps/.On the above illustration upper hanging man lower shadows looks bit short, I was just trying to fit into same size box. My apologies)
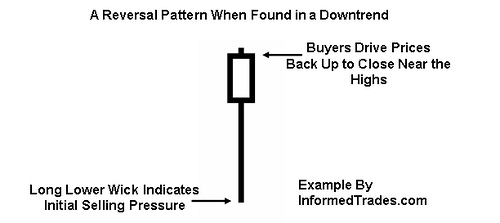
Hammer: Small body close to high with no or little upper shadow but long lower shadow. A lollipop candle but don’s start licking it too early. It’s considered as a bullish candlestick patterns during a down-trend. It simply tells us where sellers were in control but buyers were able to take charge and as a result they push the price back up near to open or above. Keep in mind, it doesn’t tell us buyers simply take total control, but it indicates that buyers getting stronger.. more buyers coming into the market.
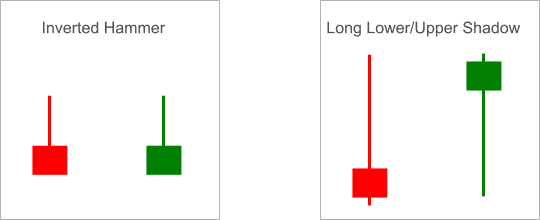
Inverted Hammer: Considered as a bullish reversal sign in a down-trend. After a down move, long upper shadow tells us there were some buyers but they failed to sustain the move as it close below their high. Need further confirmation about buyers strength. It would be better, if see inverted hammer followed by gap up or long bull candle with a decent volume.
Long Lower/Upper Shadow: Bear or Bull candlestick with a lower or upper shadow which has 2, 3 or more times bigger than total candlestick body. Bear candle considered as bearish sign while bull candle bullish.. Once again all these carries any weight in and around decent levels.
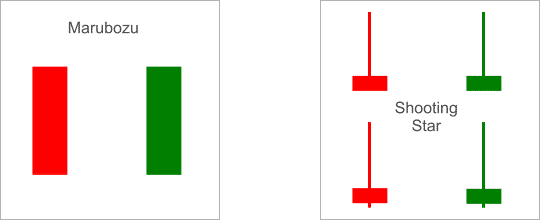
Marubozu: Main characteristic of this bear or bull candle is that there are no upper or lower shadows [wicks]. It’s considered as a continuation sign.
Shooting Star: Bear or bull candles with small body, little or no lower shadow and long upper shadow. It’s considered a bearish/reversal sign in an up-trend. However, confirmation required. It would nice to see gap down or longish bear candle after shooting star before entry.
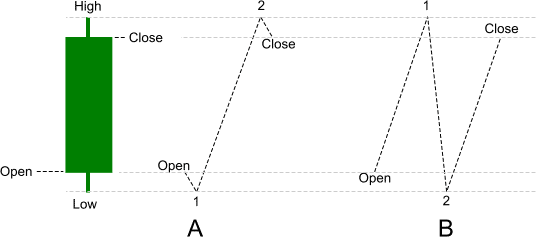
Inside a Candle: When I was new in trading and started to use candlestick charts, I use to think prices moved like in sequence A to form a candle as illustrated above. However, reality is not that straight forward. Do not assume anything and investigate it yourself to find out how it happens. If you want to see how any one candle is build, what it’s price structure, just go down to lower time frames. This could be a useful eye opener for new traders or traders new to candlestick charts.
CONCLUSION
Learn and understand how candlestick patterns from D1 Timeframe and looking the best entry on H1-H4 chart. Remember practice makes perfect. You can using this upper or lower doji wick to read strong level on D1 chart and execution on upper or lower from doji on H4 chars. Combined this two timeframe is the best way to get minimum risk on our trading activity. More practice more better we understanding about price structures. You can download and understanding about this price structures from learning this great e-book about candlestick basics.
Another references need to understand too, especially about liquidity. Here deep analysis about trading with liquidity strategy.
In the next article, we will writing top important major Reversal Candlestick Patterns and Continuation Candlestick Patterns.