Trading price with supply demand curve is very nice to learning. Basic concept of this supply demand strategy is how we look supply demand area with two line nearest based two lower low or two higher high. 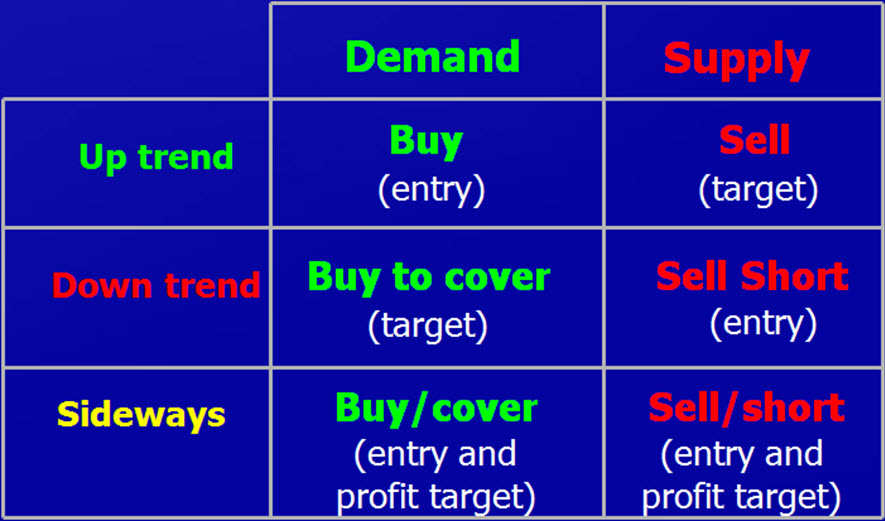 We just buy or sell on every low or high from supply demand area in control from smaller time frame like one hour time frame for intraday traders and four hour time frame for swing traders. Here we go some supply demand in control that we can learn together here. Remember strict to the rules on which way kind of traders you are. Swing traders ? or intraday traders ?. Just see details of multiple time frame analysis, so you can know what kind trader you are.
SUPPLY AND DEMAND IN CONTROL
WHAT DEFINES AN UPTREND OR A DOWNTREND AT ANY GIVEN TIMEFRAME?
Each timeframe can have a different trend. Let me define my idea of a trend. Remember it’s just my idea of a trend, it makes sense to me so I’m using it. Does it make sense to you? Use it then. Since we are primarily working with supply and demand imbalances, making a higher higher or a lower low does not necessarily mean we continue on the existing trend.
- UPTREND: demand areas are being respected, supply areas are being taken out.
A higher high SHOULD remove previous supply to validate the demand zoneYou must ask yourself: has the previous supply being removed?
If previous supply is not taken out, I won’t validate the origin of a higher high as demand - DOWNTREND: supply areas are being respected, demand areas are being taken out.
A lower low SHOULD remove previous demand to validate the supply zoneYou must ask yourself: has the previous demand being removed?
If previous demand is not taken out, I won’t validate the origin of a lower low as supply.
You can use trend lines (these can help to assess trend if you have the right rules). I am not using any lagging indicator to assess the trend, since the only non-lagging indicator I know of is Price itself. I’m doing something much much simpler than that. Ask yourself this question: what type of trading are we doing? Aren’t you trading the supply and demand imbalances you see on a price chart? We want to trade at those areas where the institutions left a trace, where smart money is lurking to hunt you. So if we’re trading Supply/Demand (SD) imbalances, shouldn’t we use the higher time frame’s SD areas to assess our trend? Remember, buy low in and sell high.
What defines a downtrend or an uptrend?
- In a downtrend: supply areas are consistently being respected and demand areas are being taken out
- In an uptrend: supply areas are taken out, while demand areas are being respected
THAT SIMPLE. Just look at your D1 or your WK chart and see what is going on with the SD areas in control and decide which direction to trade. Once you know what direction you want to go, locate lower timeframe SD areas with a strong departure, little time at the level, fresh zones, and a minimum of 3:1 profit margin (3 times or more the risk in pips of the zone you’ve taken)
What tells you if a downtrend or an uptrend has started to change or even consider there might be a reversal?
Since we’re doing SD trading, once you supply or demand in control is taken out, it will be showing weakness in that currency pair’s time frame.
We will consider a trend at any given time frame has ended IF the trend line that connected the last 2 obvious valleys (uptrend) or peaks (downtrend) has been broken.
- If 2 SD zones have been taken out, then we will most likely have the possibility of drawing a brand new trendline for our new direction, thus looking for trades in this new direction, only if there is enough room to the opposing higher timeframe SD area and we are not too high/low in the curve
- The break of a trendline does not necessarily mean that retest of a SD zone near or at the retest of the broken trendline will be valid. We need to make sure that price has arrived or is very close to a higher timeframe area, ELSE we’ll have to make for a brand new direction to the opposite side
- Do not trade the break of a trendline just because it’s just been broken, we need to assess location in the curve
HOW TO VALIDATE A LEVEL
The only reason why price moves in any and all markets is because of an imbalance in supply and demand. The greater the imbalance, the greater the move.
A strong move in price away from a level indicates that not all orders were filled. For example, at the origin of a demand level, there are not enough sell orders to fulfill the total amount of buy orders. This is why price moves away in such a strong fashion. When price returns to these levels, the novice traders (those who don’t know about supply and demand) are selling into an area where institutions (professionals) have their buy orders. Institutions and professionals buy to the novices, then there are no more sell orders so price must rise again. The opposite holds true for supply levels. In both cases, the novice traders provide the liquidity the institutions need to get their orders out in the market.
The best opportunities are where we can buy at the cheapest price possible and sell and the most expensive price possible. This is the same in any market. Supply and demand levels on a price chart show all these levels, you just have to learn how to draw them.
Open a price chart, you will see a multitude of supply and demand levels on every time frame. That doesn’t mean we are interested in trading all of them. Certain levels are more likely to hold than others, you need to have a rules based mechanical methodology as well as making a top down multiple time frame analysis before you choose the levels you want to trade.
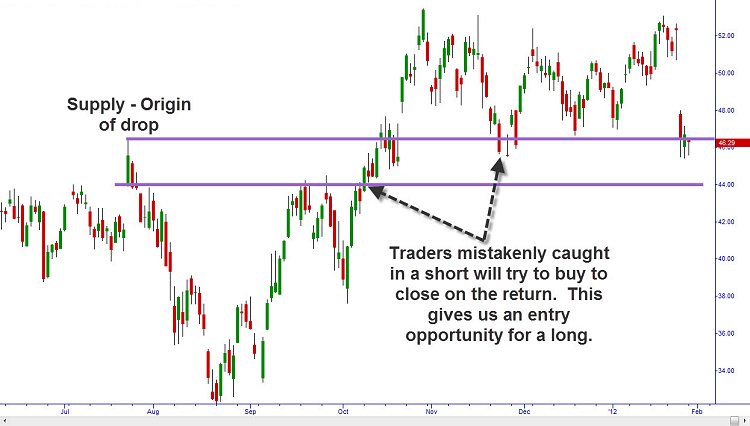
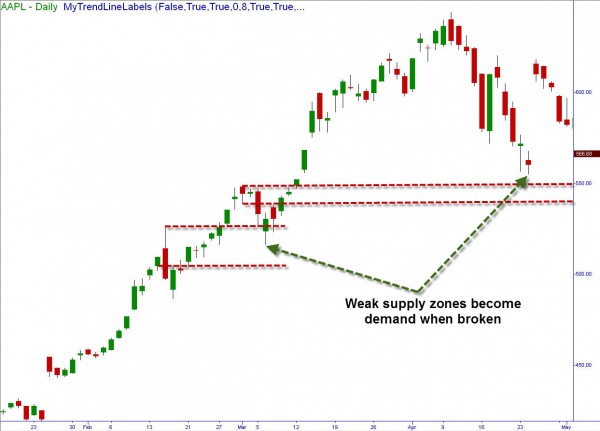
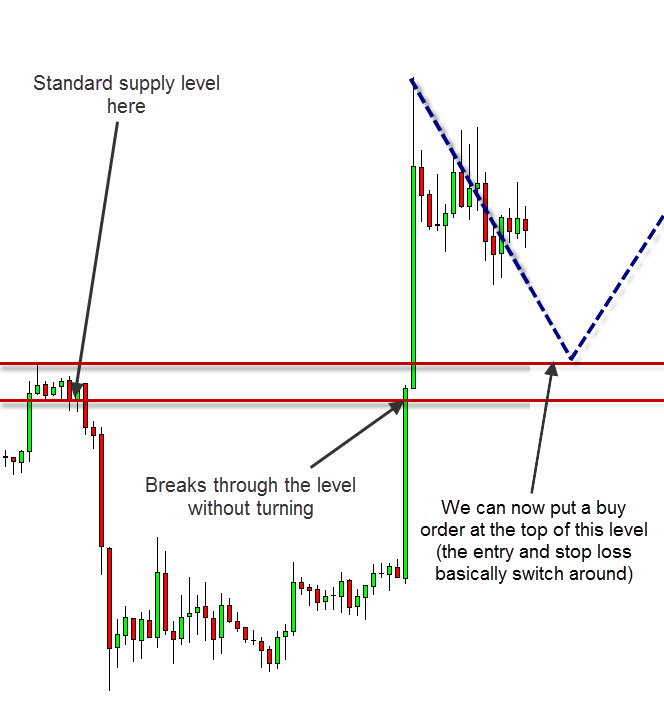
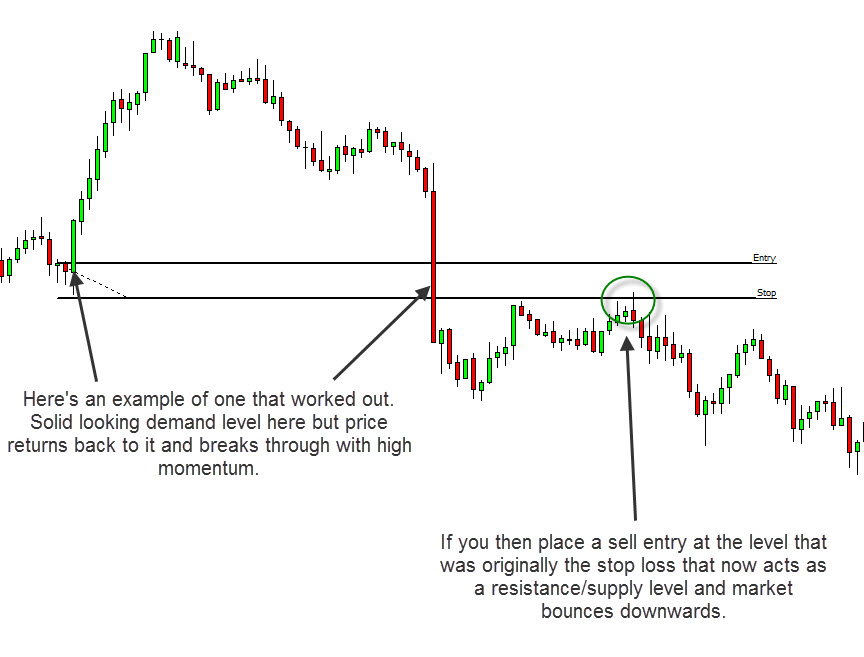
Here some sample pictures below from broken supply demand zone.
 |
 |
 |
 |
 |
 |
These are some common factors to consider when choosing levels to trade from are listed below:
- Strength of the move (departure). This is the way in which price left the level. Ideally quickly with large ERC candles
- Risk/Reward. A decent risk/reward ratio will help to ensure you have enough risk/reward for price to move to your take profit
- The big picture. Choose to trade with the higher time frame’s trend. Know where you are in the Daily and higher time frames, never go against them
- Number of pull-backs or retests. Is the level fresh and/or original? Has it been tested more than once? Fresh levels are best for trending markets, the fresher the level the higher the probabilities
- Time spent at the level. The less time prices spends at a level, the better. This indicates a greater supply and demand imbalance
- Arrival to the newly created level. Arrival into a level is key to set & forget your trades. Basing before a level is not a good sign. Opposing levels near your entry level subtract profit margin from your area. Look for a smooth rally or drop into your entry level. But you don’t want to spend the whole day staring at the charts, you have to trust your levels and analysis.
- Dollar index. The US Dollar Index (DXY) is an index of the value of the United States dollar relative to a basket of 6 major currencies. How do you think such an index can affect forex? A lot! If the $ index is at a higher time frame supply and the euro is at a higher time frame demand, we have to go long, there is no other thing we should be thinking!
The variables above are some of the main factors that should be taken into account when deciding which levels to trade. I personally use these variables to fine tune the level picking process. Remember that trading is a game’s number, it’s all about statistics.
When the Strength of departure (imbalance) is not that “important”?
Don’t get me wrong. The strength of departure is what defines an area of supply or demand. The stronger and more explosive the departure, the stronger the imbalance. But… there is always a but…
- When we are bouncing off higher time frames the departure (imbalance)
I mean, yes it’s important, strong and explosive imbalances are great, but if those strong imbalances happen at a higher time frame area, price will most likely not return to that area in short, it might do after some time, days or weeks for a retest - If price is printing new CP (continuation patterns) off a higher time frame area, that means there are willing buyers/sellers. Imbalance will not be that crucial when that happens and we are still quite low in the curve to buy at demand, or high in the curve to sell at supply
- If the imbalance is great and price returns to the area shortly after, it’s not a good sign either, price needs to consolidate away from the level and not return to it in the next couple of candles. Why is it not that important? Because we want to be riding that zone as soon as possible, those are accumulation/distribution periods, big imbalances can happen but not always. There will be times when we will have losses, that’s taken for granted and they are welcome, but overall we will have an edge, and that’s the most important thing
SUPPLY AND DEMAND IN CONTROL
- 1.On every time frame there is an area of supply and demand in control, that is, once price reaches that area, sellers/buyers will be likely in control and price will most likely have some reaction. We’re always talking about odds, we can’t assume or predict that something is gonna happen. If the zone is fresh and good, price will likely drop quite fast and no kind of confirmation will work. If the zone has been touched once or more times, then it will probably not bounce that fast or even break that area. That territory is where sellers will probably fill their orders again. So, supply is control when price is high in the SD curve.
- 2.What is a supply or demand in control? It’s the previous fresh or un-fresh SD area which has not yet been broken (taken out). If a supply zone has been hit 10 times and the distal line (furthest away price from current price) of that zone has not yet been broken, that zone is still valid, that zone is still the supply in control. You can’t, you shouldn’t assume or predict that you can buy that high in the curve on the assumption that it will be broken. The market will show you when that zone has been broken, you are not the market, nobody is the market. Once it’s solidly broken, you will be looking to go long at a good and fresh demand area, but don’t buy into a supply zone in control until it’s been clearly and solidly broken, it’s higher odds and we want those odds in our favour. A zone can resist 1, 2, 3, or 10 pullbacks. Only trade when it’s solidly broken
- 3.Buy low in the curve. Sell high in the curve
- 4.Don’t diddle in the middle. If the levels are in the middle of the curve, then price can probably go both ways, skip those levels to avoid unnecessary losses
- 5.The higher the timeframe, the higher its reliability. That is, if we have a WK supply zone, even if that zone is not fresh and has been hit 5 times, it’s still a higher timeframe supply, it will probably hold more than a M15 or a H1 zone. Why? Because the smart money, the institution, the big fishes, will be looking to position themselves on higher timeframes. They will probably not be looking at M5 and M15 to fill 100 million euros on the EURUSD. Maybe some might, but most likely they just don’t care much about lower timeframes, moving averages, CCI, RSI or MACD, most of them are not scalpers but swing and position traders, so why should they care about filing orders in the middle of nowhere? For higher odds, they don’t diddle in the middle. They are market makers and they know what you are doing, remember. They buy low and sell high in the SD curve.
- 6.Trade with the trend for higher probability. The trend is not a straight line, SD levels will work in both directions at any given timeframe, with the traend and counter trend, but the higher odds is to go with the trend until it ends. But where will it end? Near or at a higher timeframe supply/demand area. Avoid unnecessary losses trading against the trend in the middle of the curve, you will increase your % success quite a lot if you do it that way. You will miss many trades for sure, but you will filter out many losses as well. You decide, well, your emotions will decide, and that’s not good So behave like a robot
- 7.Decide if you want to be a hero by trading counter trend high/middle/low in the curve, or you just want to go the safe way by buying the dips and selling the pullbacks with the current higher timeframe. . See the 4 setups graphic above for clarification.
First of all let’s go through 2 important statements:
- 1.A higher high does not necessarily mean a new demand area was created
A higher high could be “just that”, that rally could be the final thrust to hit a strong supply area on higher time frames - 2.A lower low does not necessarily mean a new supply area was created
A lower low could be “just that”, that drop could be the final thrust to hit a strong demand area on higher time frames
THE CURVE or THE RANGE
Let me show you a couple of examples of supply and demand in control in higher time frames, what it’s called the curve.
Remember, for higher odds we want to buy low in the curve and sell high in the curve.
So these are the steps you need to take:
- 1.Decide which kind of trader you are: are you a scalper, intra-swing, intraday, or swing or position trader?
- 2.Once you know what kind of trader you are (not that easy because your mind will want to trade on all time frames, you will see SD levels on all charts, with the trend and counter-trend, you will chase trades), decide which is the time frame for your curve.
- 3.Use the WK chart as the curve for your swing trading. D1 can also be used.
- 4.Use the D1 chart as the curve for your intraday trading
- 5.Going lower than that will be placing more odds against you, you can use H4 or H1 for scalping, but I will never do that. But each trader will decide, but whatever you decide, forward test it hundreds of trades. Don’t back test, you will see what you want to see.
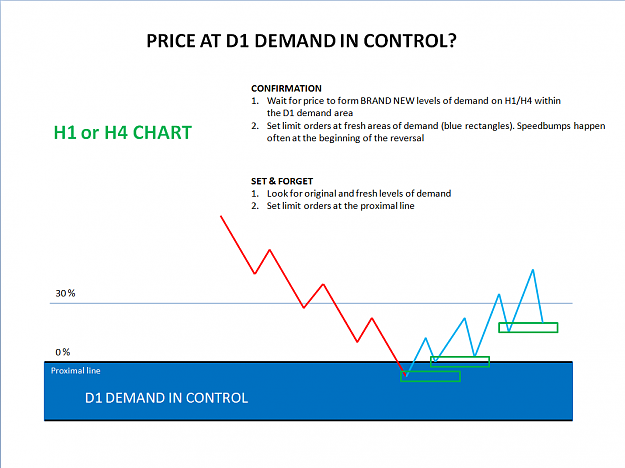
- 6.If price is at a higher time frame supply (D1, WK or Monthly), don’t go long. Wait patiently for a short setup, either set & forget at an original and fresh supply level on H1/H4, OR wait for a brand new level of supply to be formed and sell the pullback. Opposite for higher time frame demand.
In the following NZDUSD chart, yesterday’s Friday close (17th May 2013), the trend is down, why? Not because you can clearly see that price has been dropping for the lasts days, that’s crystal clear at the forex trading with no indicators. You can see a clear down slope trend line pointing down (not painted on my chart). The trend is down because in a down trend, supply areas are respected and demand areas are taken out (broken), that simple. . We’re using, we should be using SD areas to assess our trend, other tools can help you, but they will be accessory.
The first 77 pips red supply is the D1 supply in control. Why? Because it has not been taken out yet, so sellers are in control near or at that area. Why the lower 49 D1 demand in control is in control, for the same reason, zone has not been taken out yet, so buyers are in control. That simple. You don’t need to add any indicators to assess what is going on on your charts, institutions leaves traces in the charts in the shape of strong imbalances.
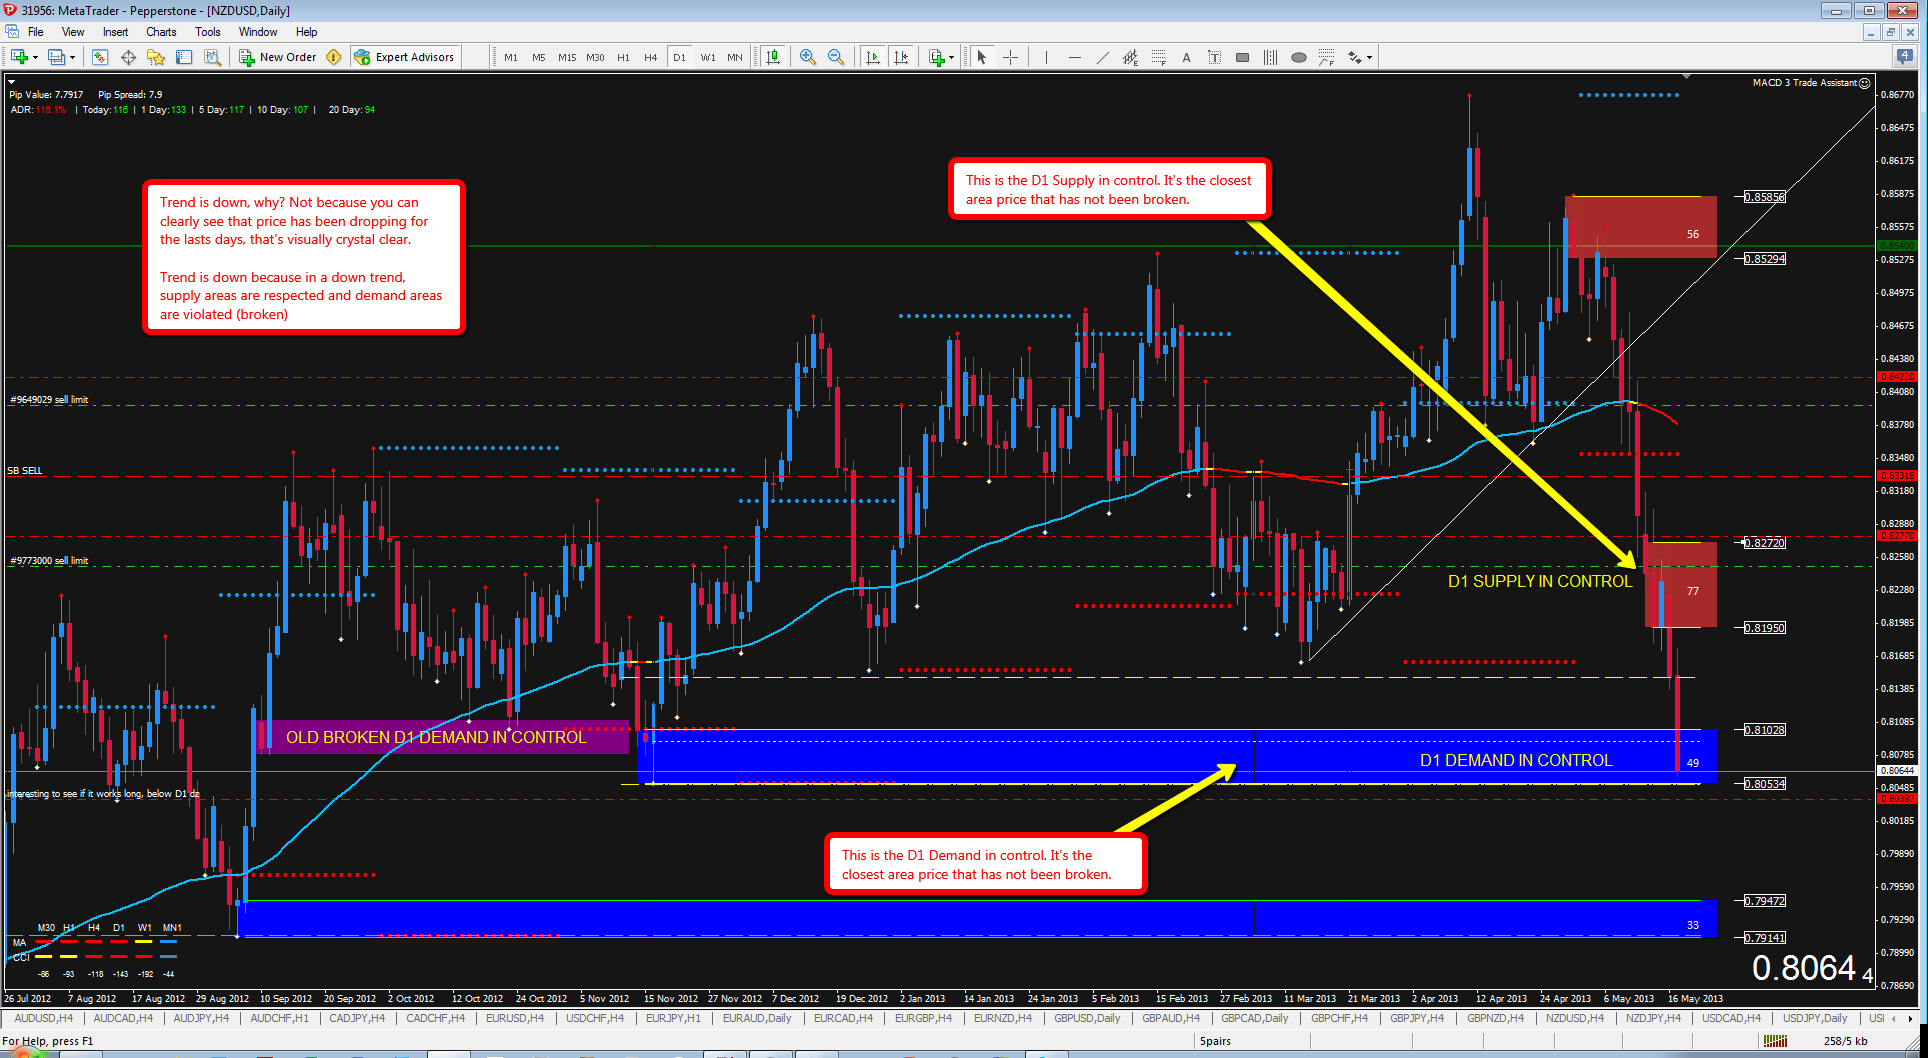
Since we are in a downtrend, we want to sell, not to buy. We’ll only buy if we’re close to a higher time frame D1/WK demand area, the fresher the better, the bigger the imbalance the better. The lower D1 demand area with 33 pips is got a really nice imbalance, strong unpaused departure, very different to the one where price is located now.
More details about this concept of forex supply demand trading strategy, just download this great supply demand pdf trading strategy or you can visit this great thread visit at www.forexfactory.com/showthread.php?t=428204and don’t forget to learn it and the most important is practice at least 3 month and get your pips easily.