 Today we’ll learn about what exact definition of price action forex trading analysis. Using price action forex trading analysis is almost called “how to read market movement only from clean charts forex“. You can analyze the forex market, option gold spot, or anything using this forex clean charts strategy based on price action only. Just remember to do an accurate price action analysis only on at least a four-hour time frame and execute it in the one-hour time frame. No need for any indicator again, but you’ve to find which HH (Higher High), HL(Higher Low), LH (Lower High), and LL (Lower Low). In the end, this parameter will be exactly the level which you best trade with. In the end will know what exactly the price will go.
Advanced Price Action Analysis Forex Trading
If we talk about price action forex strategies, we need knowledge about support resistance, forex reversal candlestick patterns, and forex candlesticks basics. Because price action forex analysis can done with only read repeatable testing zones time by time. Many forex traders use price action trading strategies based only on candlesticks patterns. But, what best time frame to read candlestick patterns as support resistances? I suggest reading from at least the H4 time frame, daily chart, or even weekly chart. These 3-time frames are better and have strong bases for intraday traders and for swing forex traders. Because in big time frame represents strength-based patterns so support resistance more stronger Besides this big time frame, the trader’s volume is bigger as always than if we compare with the smallest time frame that has many small ranges, weak support resistance, and fast-changing variables.
Sometimes we get difficult to learn how price action works because so many price action versions that we can find in many forex resources, such as forex forums are forex factory, baby pips forex forum, price action books, price action tutorial, price action free pdf, price action forex trading from YouTube but at the end just little bit of those forex price action methods give us a clearly price action forex trading strategy which have a awesome forex trading signals.
Moreover, with price action trading signals we don’t need many forex indicators again like Fibonacci, EMA, MACD convergence divergence, ADX, Bollinger band, and many other forex indicators that sometimes make our analysis more difficult. Those forex indicators we can use later as our alternative forex tools but not primary.
So, first of all, we only need a clean chart Meta Trader to read the best price action trading setups that we need to measure as our based zones to get the best forex signals entry.
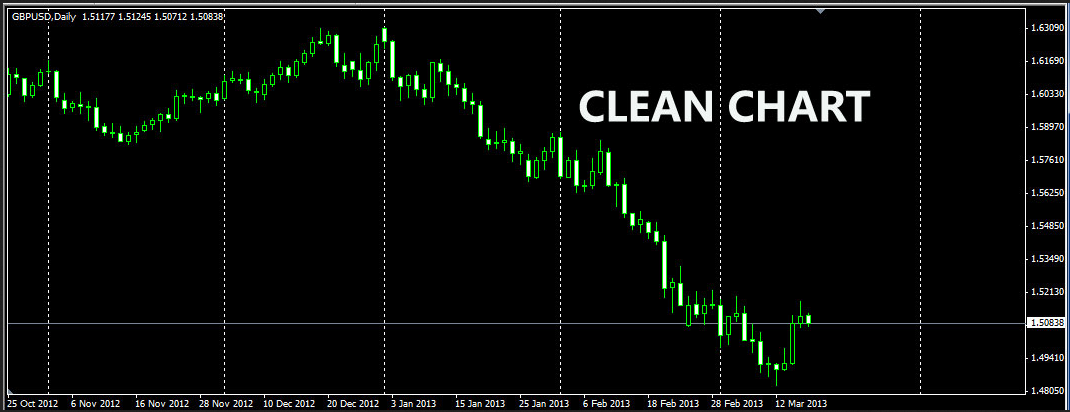
Here are the different clean charts vs “messy” charts:
The image example below shows a clean price action chart, with no mess, and no indicators, just pure price action bars:
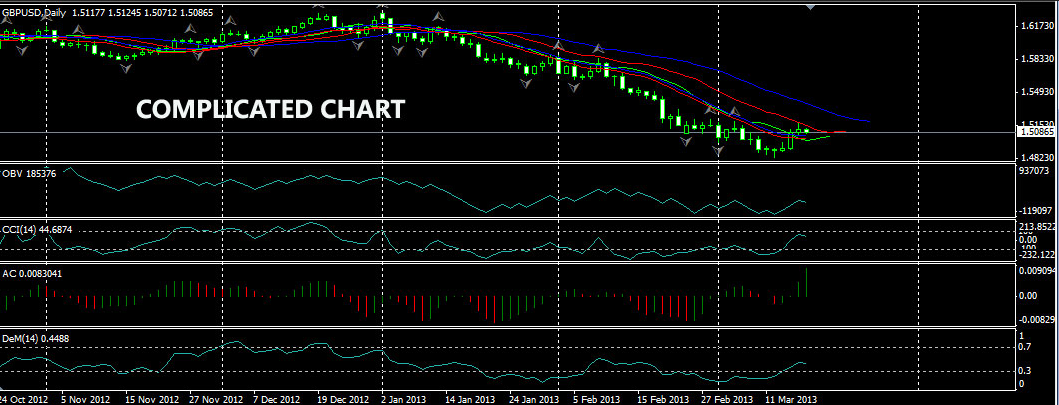
The image example below shows a complicated price action chart, with lots of clutter, indicators and complex :
Forex Price Action Reversal Patterns Based Forex Candlesticks Strategy
It’s clearer with a clean chart right? Now, basic price action trading setups are by reading reversal candlesticks patterns from 4H, Daily, or Weekly charts that are near support resistance zones. Those reversal candlesticks patterns we’ll use as our strength support resistance zone. If the price goes to these zones, the price always reacts and makes a new zone consolidation in a small time frame. But remember support resistance is not our primary variable analysis, because this support resistance zone has more false breakouts so gives false signals too, but if we use reversal candlestick patterns nearly with this support resistance zone in the daily chart as our basis it’s more accurate enough.
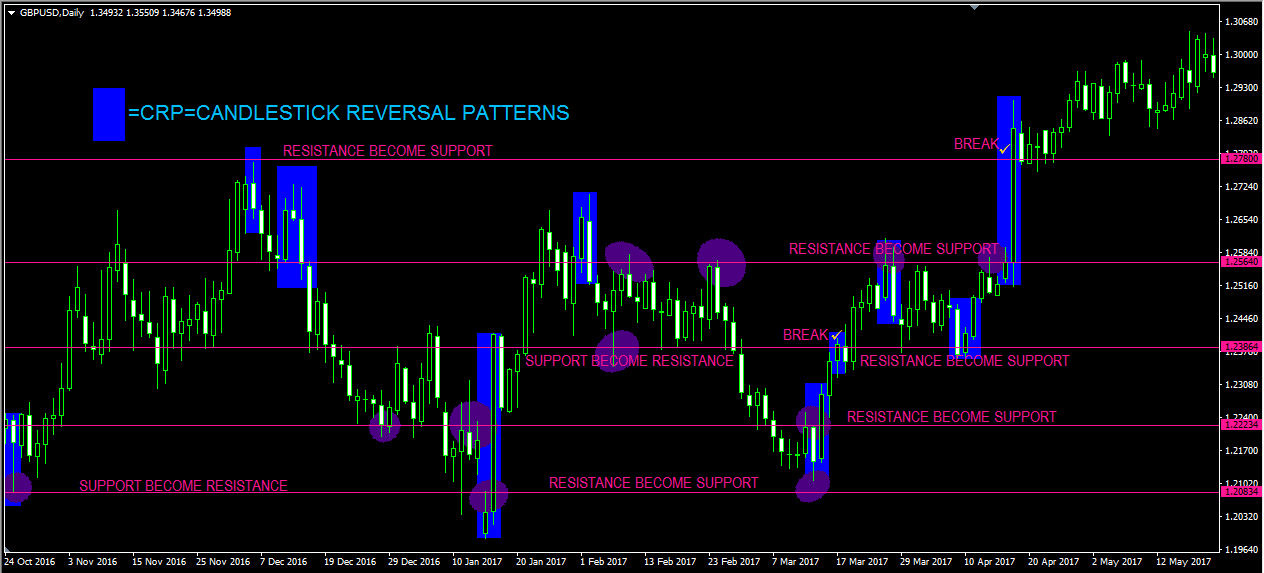
From the picture above, we can see how many times support resistance break but after then not directly break the reversal candlesticks pattern is because price always respects old reversal candlesticks pattern. But at least with a break support resistance line it signs that a new cycle will be formed with the new bargain will be repeated and this represents with new candlestick reversal pattern being formed in the new zone.
Now, how can we identify old bearish reversal patterns that we’re using as resistance level is vulnerable to break? It’s simple. The answer is a full-body candle. Why a full-body candle? is because a full body candle or candle bank or anchor candle ever it’s called represents volume buyer and seller take action in big volume. So, if we represent full-body candle bull for the buyer and full-body candle bearish for the seller it makes sense right? See the picture below to see when the seller is defeated by the buyer then the buyer takes control of the market or when the buyer is defeated by the seller then the seller takes control of the market. This is what the market psychological said about the current condition whose taking control.
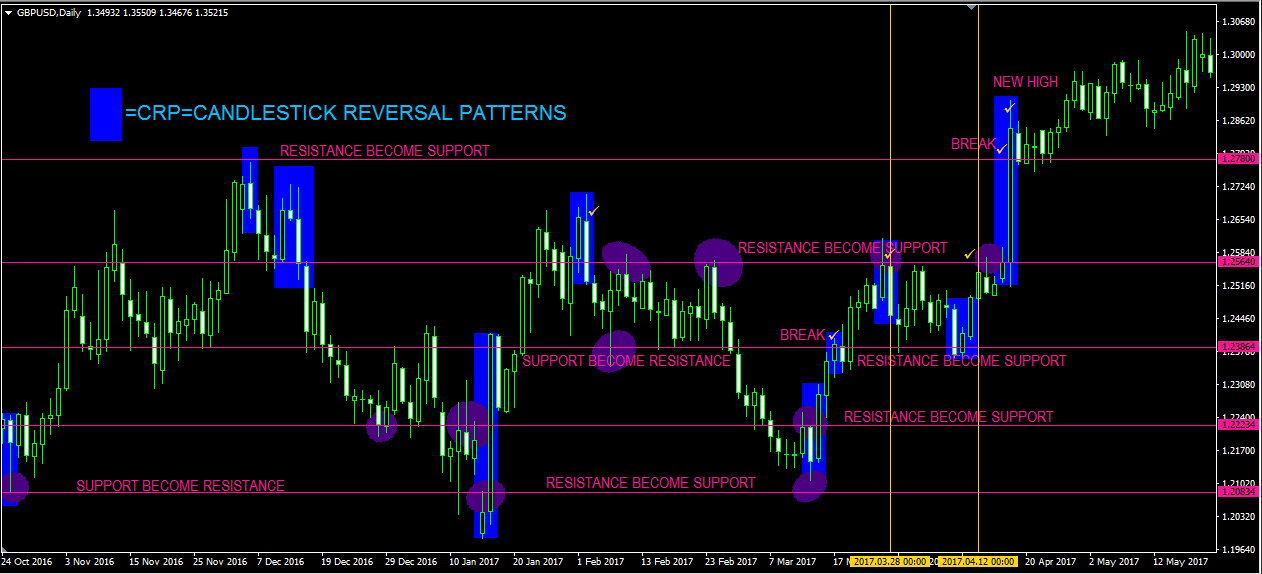
See full body seller in bearish engulfing on 28 03 2017 defeated by full candle buyer in continuation prices of morning stars bullish reversal candle from 07 04 2017 until 12 04 2017 so, in this case, buyer taking control so just looking for a long entry in nearest bullish reversal candlestick patterns in smallest time frame M15 to 1 hour. We can see the price go up with a strong uptrend and make a new high record.
By reading strong support resistance zone-based reversal candlestick patterns and combining it with reading in multi-time frames, we can be scalping forex traders, swing forex traders, or even long-term forex traders. Or you can learn how swing forex works based on price action and Fibonacci retracement strategy.
Accurate High Winning Rate with Price Action Strategy
This is how the price action trading formula works. Then our goal is to practice using this method combined with multi-time frame analysis. So, in the end, we need more practice to read how candlestick reversal patterns work very accurately. No need to think about making a price action forex robot or looking at expensive price action forex courses or price action indicators. With practice reading easy price action trading strategy using reversal candlestick patterns based full body candle, we can master price action forex trading setups as well and minimize our risk trading from margin calls.
I hope today’s introduction to Price Action Forex trading has been a helpful and enlightening lesson for you. No matter what strategy or system you end up trading with, having a solid understanding of price action will only make you a better trader. If you’re like me, and you love simplicity and minimalism, you’ll want to become a “pure” price action trader and remove all unnecessary variables from your charts. If you’re interested in learning how I trade with simple price action strategies. Happy trading using this great price action strategy and don’t forget to learn our recommended 5 major candlestick reversal patterns too.