
 Valid support resistance is the main analysis from trading forex. The support resistance level is similar to supply demand technical analysis. The Forex market has these rules. Support resistance trading technique can be used at least in the one-hour time frame as an intraday trading strategy or swing forex strategy read from four hour and daily charts are better to get swing signals. Like intraday trading is very exciting if we know the bouncing of the level entry price. How to know the bouncing of this level entry price? Surely understanding how to read strong support resistance areas as our analysis indicators is a must. The main principle of market movement price is always looking new high or new low right? But why sometimes the price does not always make a new low or new high? Or maybe we can say that the market almost 90% moved from fresh and new support resistance levels as new high or new low to old support resistance zone and vice versa.
Determining valid support resistance is very easy enough. Even from clean forex charts from our mt4 trading platform. Usually, professional forex traders read strong support resistance areas at least based four hour time frame and daily chart, or if we like a scalping read only from a one-hour time frame and get scalping forex signals on a small time frame using 30 or 15 minutes based reversal candlestick patterns confirmation or with over bought over sold indicators to minimize the risk. Test with yourself how this support resistance level is very important before we make decisions to take action on buy or sell positions.
Today I’ll share some forex tips in how we should trade forex using a support resistance strategy properly.
Identify Strong Support Resistance Areas With High Accuracy
First, we need to read strongly based on support resistance level on a daily chart or at least from a four-hour time frame. Just marks the areas that have many prices bounced in at least three times and all retest prices are rejected and make a strong base to make a continuation wave or swing. Remember this support resistance level is not a line but a zone or range or area and in this area usually formed by reversal candlestick patterns. And use daily first then go to a four-hour time frame to look at these support resistance levels.
According to our forex journal, usually, if at least 2-4 bullish reversal candlestick patterns appear in equal or in parallel or in one area it indicates that a strong support area will be formed and will be valid if appears long full body candle up or buyer to confirm those reversal bullish candlestick patterns or vice versa. But if the long full-body candle is down as a strong seller candle appears on this strong support area it means the strong support area which has many bullish reversal candlestick patterns is expired and becomes a strong resistance zone. This reversal candlestick strategy minimum read from the H4 time frame or daily chart is much better.
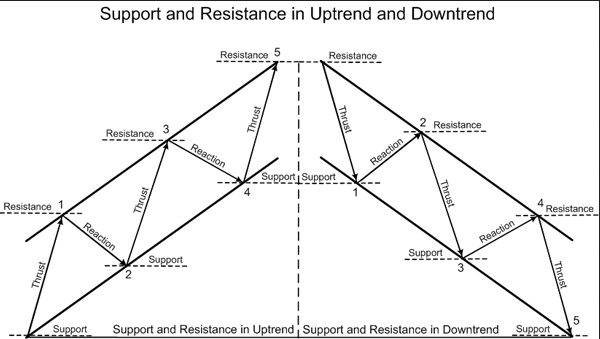
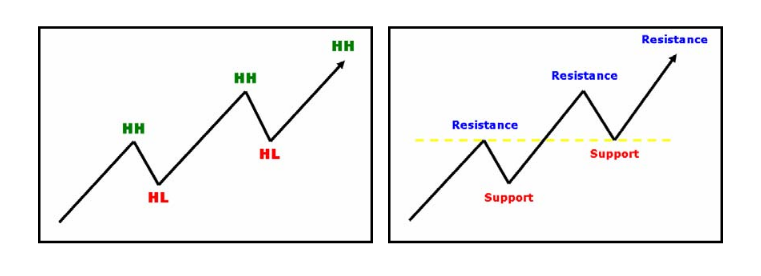
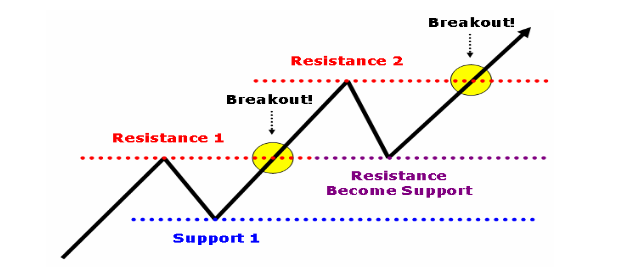
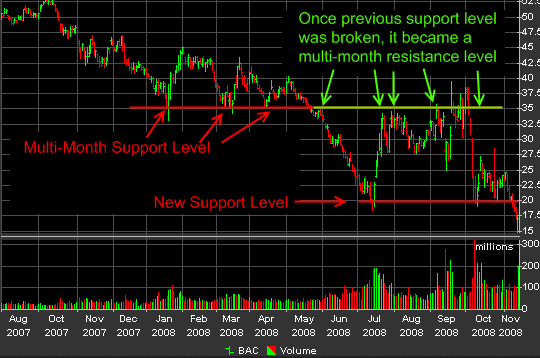
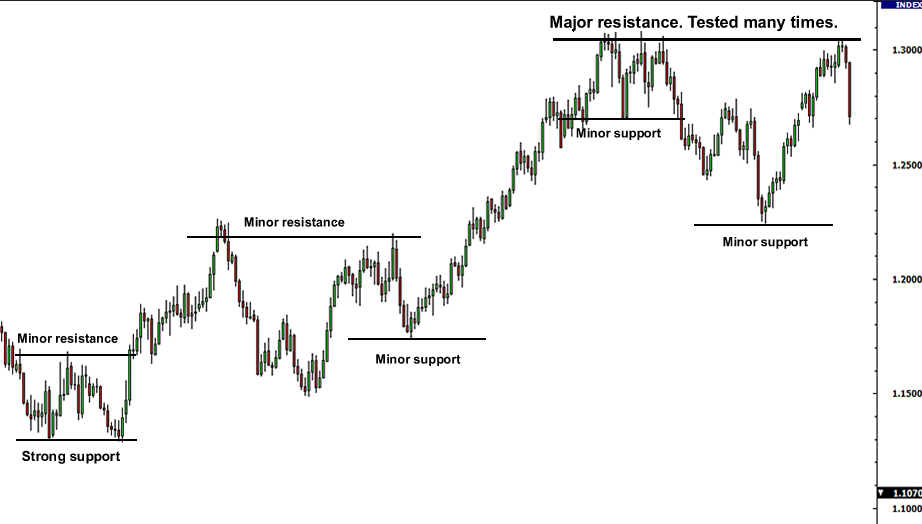
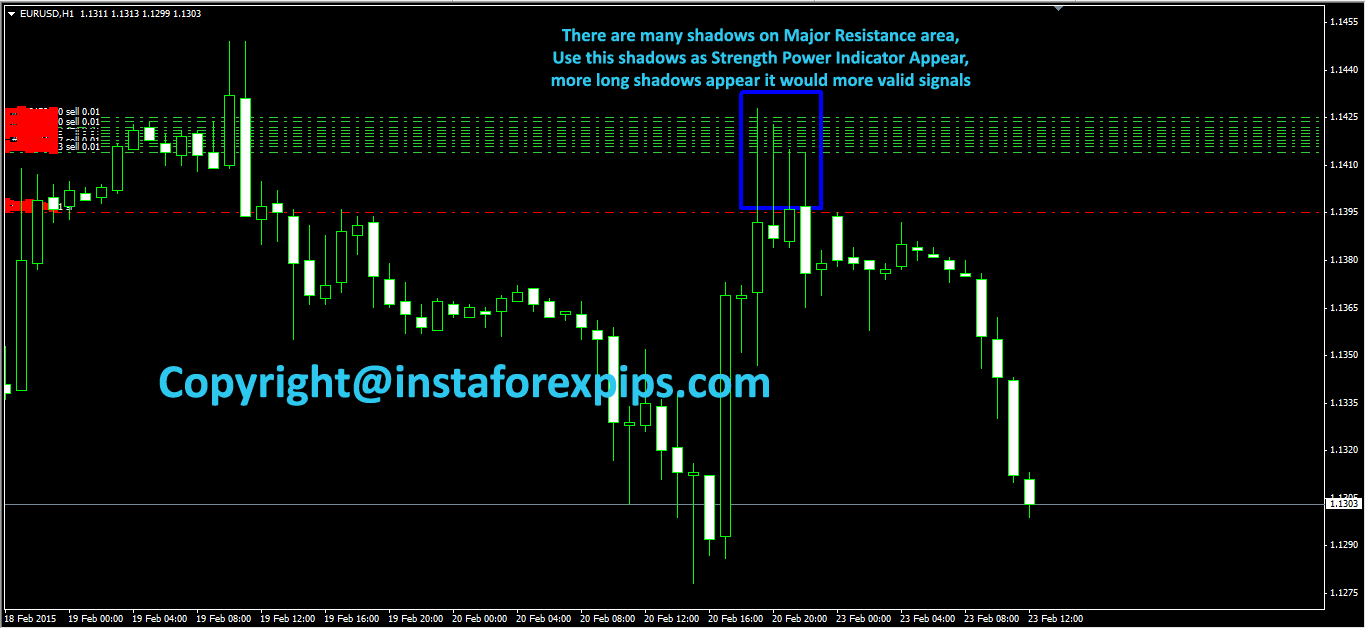
Here are some pictures below of how the price reacted to support resistance levels…
How To Trading Forex With Support Resistance Strategy Correctly
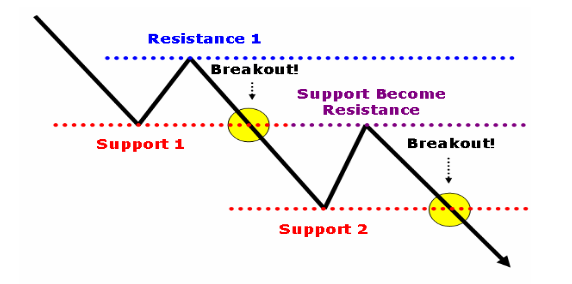
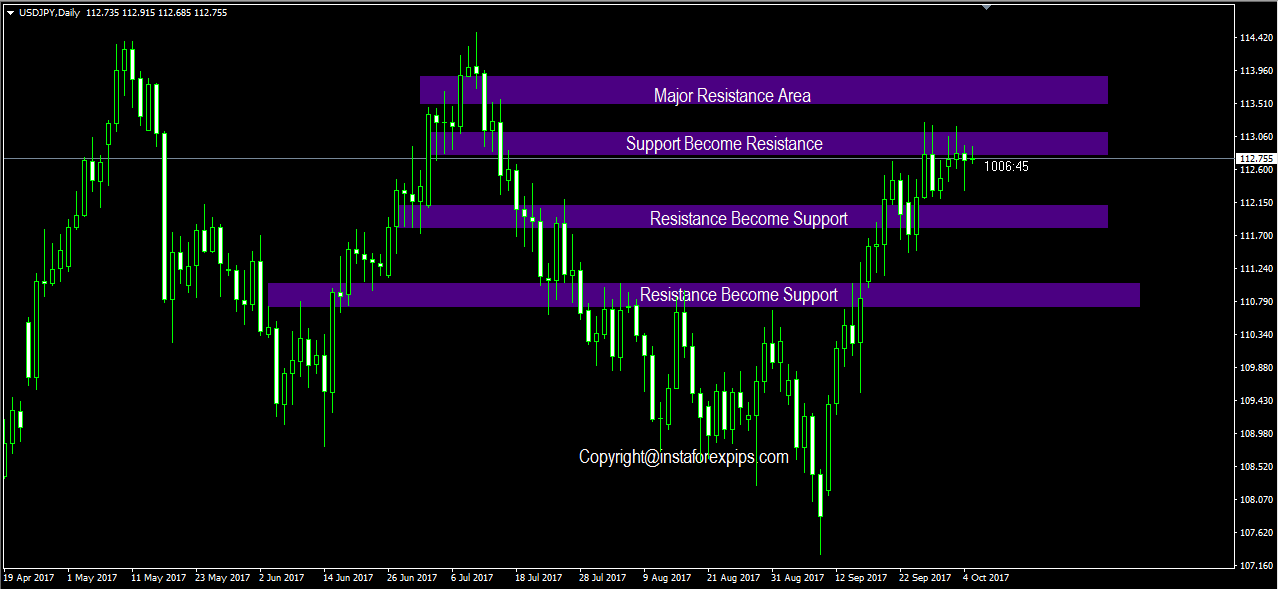
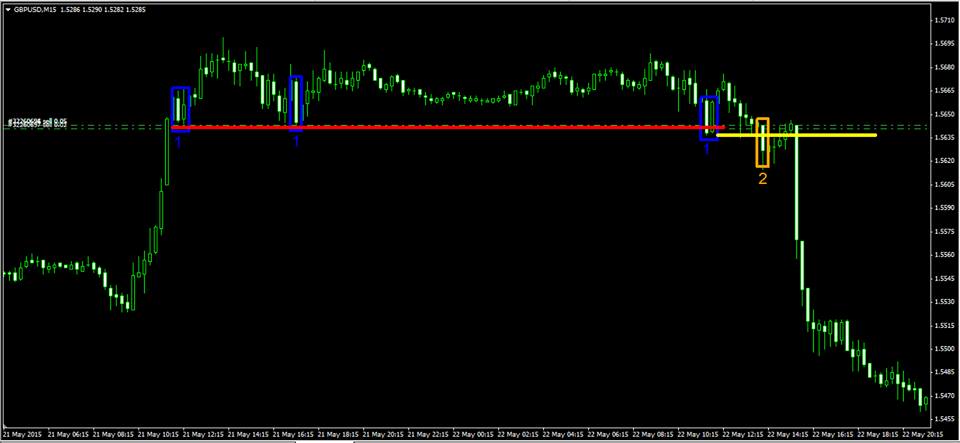
After we draw support resistance areas on the daily chart, wait first until the price goes into this strong support resistance zone. If the price is already entered into this support resistance level then we checked variables forex signals confirmation among others: are there any reversal candlestick patterns confirmation or not? Or we can check with the variable: are there many price rejections that represent shadows or not? Or are there breakout support resistances with full-body candles? if this happens then wait for pullback then we trade with an averaging strategy. If we’re using reversal candlestick patterns as our confirmation forex signals at least use four-hour time frames as our validation signals, never use them on an hour chart or below. This support resistance trading method can be as no repaint forex indicators too like a pivot actually can be as our a new support resistance level too. See sample images below :

And for the last, sometimes trading forex looks like it has a simple analysis but in the end, we need more variables to get accurate forex signals at least we’re using the daily or four-hour chart as our primary time frame analysis because on big-time frame support resistance more static or more strong enough to counter the running price as long requirements variables that already explained above have been met.
And remember to trade forex with the best of the best-recommended forex brokers in the box below to get an honest physiological of the forex market on using support resistance strategy as our first variable in analyzing market movement. And still, be wise in our lot management even confirmation forex signals appear on the support resistance level to get withdrawal consistently in every month. If we patient waiting a new confirmation reversal candlesticks patterns as our primary signal usually not only 10-20pips we’ll get but a hundred pips we’ll get. Just for reference, you can download this free support resistance tutorial to learn more about how to read support resistance levels with ease.