Supply Demand Trading Concept Still Need To Be Filtered With Candlestick Patterns
 Forex trading sometimes is very complicated.Even some traders loss almost their all saving money. Why it can be happened? It’s because some traders only using their emotion on their analysis and forget about money management and off course 90% traders using their instinct. As we know the core of economy market is supply demand. Because of this we have to concern about this supply demand trading concept, but remember this supply demand trading concept still need to be filtered with knowledge about reversal and continuation candlestick pattern. An this candlestick pattern have to be located on supply or demand zone, so not between on supply demand zone. So with knowledge about this candlestick pattern which located on supply demand zone, we can read the power of seller or buyer will remain.
Because every time frame have their supply demand controller. And trading philosophy in identifying strong support resistance or valid supply demand is by seeing how many time that price retest a specific price zone. From our experience, if price have trying retest more than three times and broken so that zone become strong supply demand area or maybe some traders call this zone is strong support resistance.
So, from this strong supply demand concept zone, we can minimize the risk and getting big reward on our trades. There is no holly grail in forex. The holly grail in forex is about risk controller and money management it self. After we can identify this supply demand zone the second way is reading candlestick pattern. The continuation or reversal candlestick pattern should be located on this strong supply demand zones.
Here is the major reversal candlestick pattern that we should use on our trading analysis before we make some decision buy or sell.
Here is the major continuation candlestick pattern that we should concern in holding our trading position.
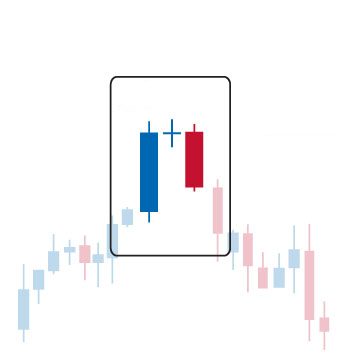
First, we will explain about reversal candlestick pattern from morning or evening star.
Morning / Evening Star Candlestick Patterns
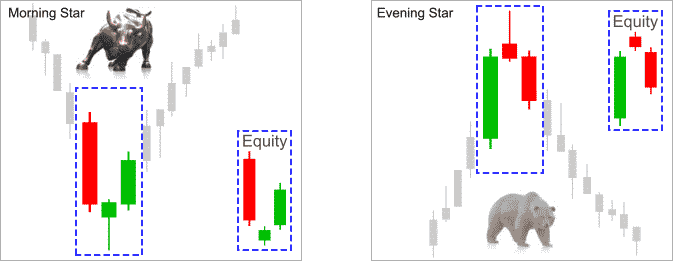
Morning Star
Morning star candle pattern is a bullish reversal candle. We’d be looking for it in a down trend. But where? It looks all fine on the drawing above but in real life it may not be as clear as that. Sure, the above illustrations are only for giving you an idea what it’ll look like approximately. We may see similar patterns on the way down and still continue to move down.. We keep say the following but I don’t see any harm of repeating again and again:
We look left and trade the right.
We look left to see what has happened before on these levels. Is there any important historical lines and levels. If there is then we will much better probability for the pattern to work as suggested. Otherwise we ignore. Further details about identifying levels and the pattern we are talking about in the following paragraphs with real chart examples. However, before that lets examine the what morning star made of.
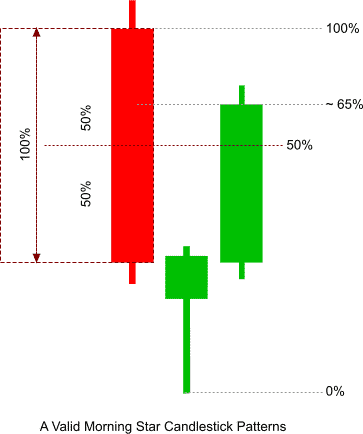
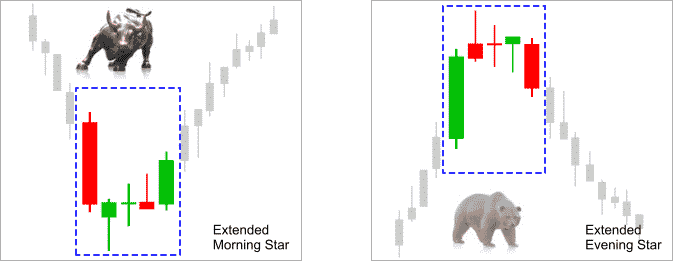
Essentially we need 3 candles to form morning star
1.First bar is large bear candle within defined down-trend. Bears are still in charge.
2.The second bar can be bit tricky. It may look like bull or bear hammer with long lower wick. It may also be a spinning top or doji candle. Main thing is here bulls are starting to talk.
3.The third bar is a largish bull candle. The third candle should close at least more than the halfway above the first candle [large bear candle] We need to wait until third candle closes to see if it’s a valid morning star or not. Let the fat lady to finish her singing before jumping in any conclusion.
Evening Star
It’s simply bearish version of the Morning Star candlestick pattern. We’d look for evening star candle pattern in an up-trend. Just reverse the logic and you’ll have evening star. Still made of 3 candles.
1.First bar is large bull candle within defined up-trend. Bulls are still in charge.
2.The second bar can be bit tricky. It may look like bull or bear hammer with long upper wick. It may also be a spinning top or Doji candle. Main thing is here bears are starting to talk.
3.The third bar is a largish bear candle. The third candle should close at least more than the halfway down the first candle [large bull candle] We need to wait until third candle closes to see if it’s a valid evening star or not.
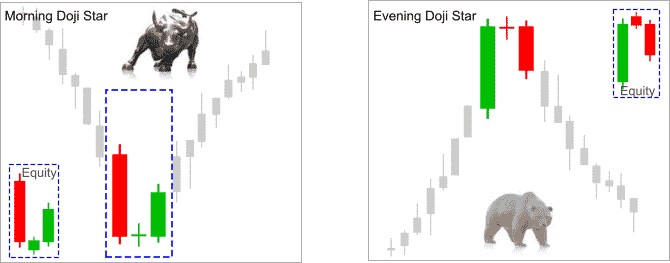
Morning Doji Star Candle Pattern
Same as above.. only difference is that second candle formed as doji rather than hammer like.
Evening Doji Star Candle Pattern
Same as above.. only difference is that second candle formed as doji rather than hammer like.
Some says morning and evening stars can have more than 3 candles as illustrated below. I’ll try to stick with the basic definitions rather than complicating things.
Important aspect to remember morning/evening star candle patterns carries much more weight they form in and around the supply and demand zones, like other reversal candle patterns.
Don’t mix the chart patterns with candle patterns. Once I have gone through important candle patterns I’ll move in to explore chart patterns.
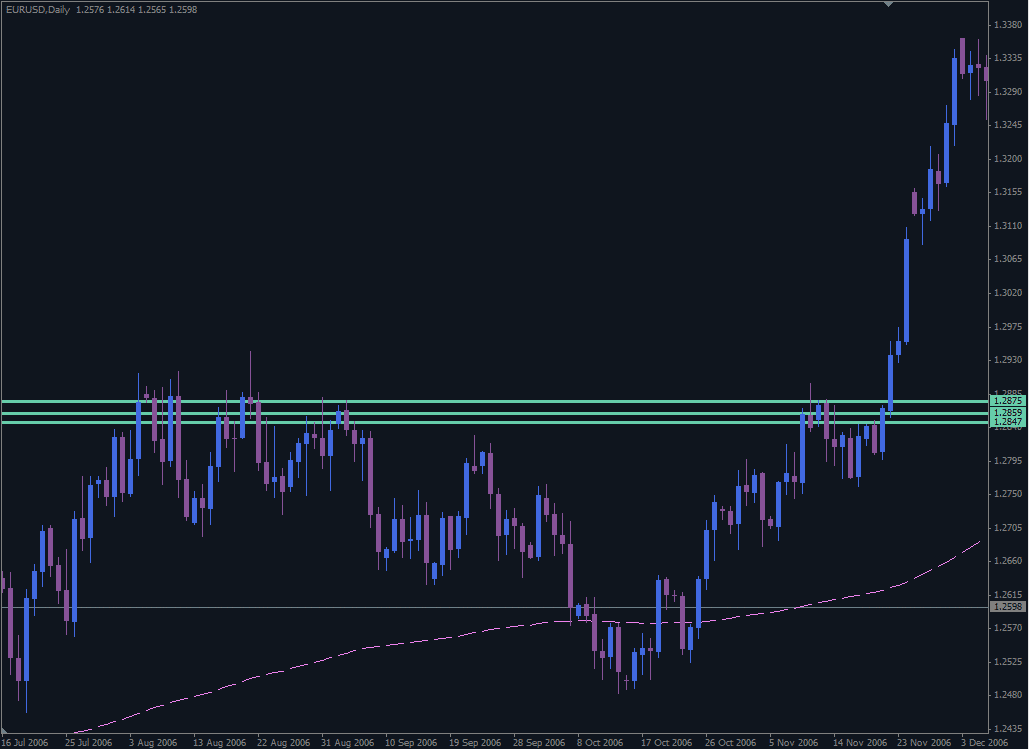
Here some example in real charts from our metatrader platform :
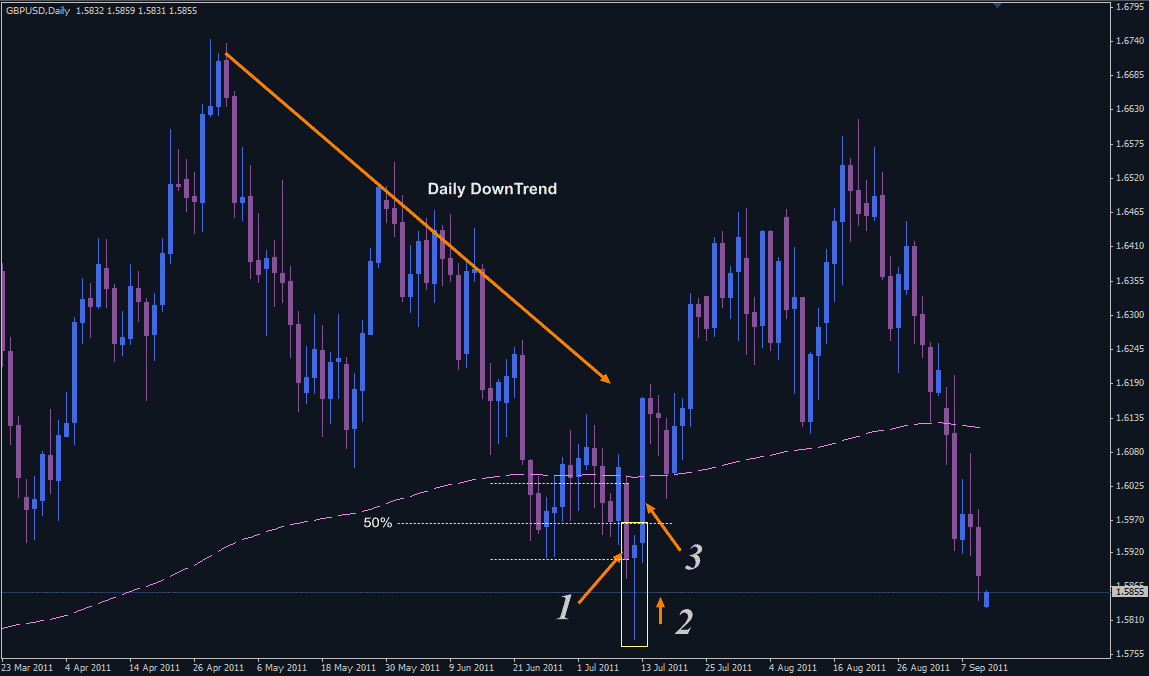
Morning Star
A very nice looking morning star. If the third bar wasn’t quite large it’d would have been even more nicer. We are in daily down-trend. We have our large bear candle [1], then hammer look a like bar with a long lower wick [2], and finally [3] we have our bull candle which is more than half of first candle [bear] body, we have our pattern completion bull candle.
When we see such large bars [candle number 3 in this case], sometimes it pays much better if we wait and enter on retracement. More often than not after large bars we usually see some retracement. Most likely there will be some quick profit taking and re-loading take place. However, in news and unexpected events times the above will not apply as described. In such times price can move very fast 100+ pips in one direction without any retracement.. Extreme greed or panic would be the story of the day.
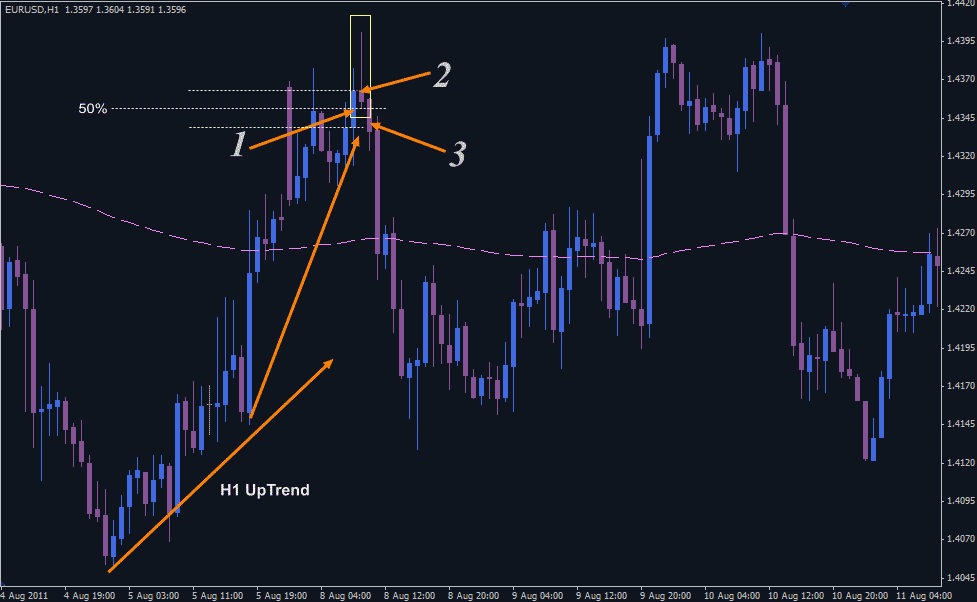
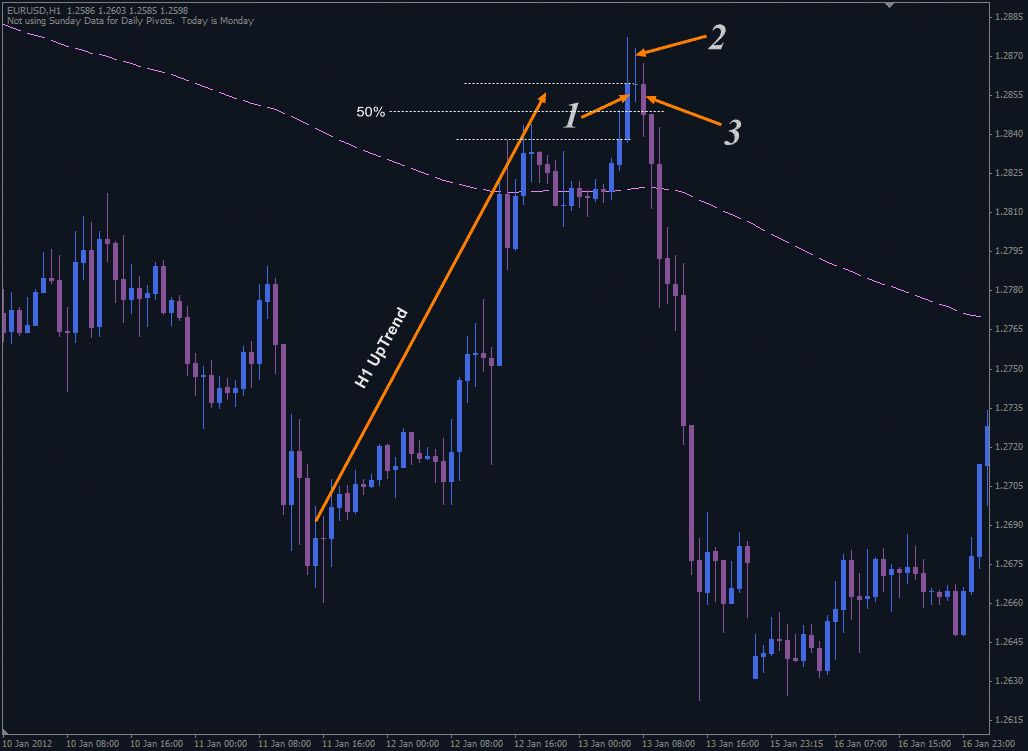
Evening Star
As you can see just the opposite of morning star. We have an up-trend on H1 and we have our 3 candles nicely forming the evening star candle pattern.

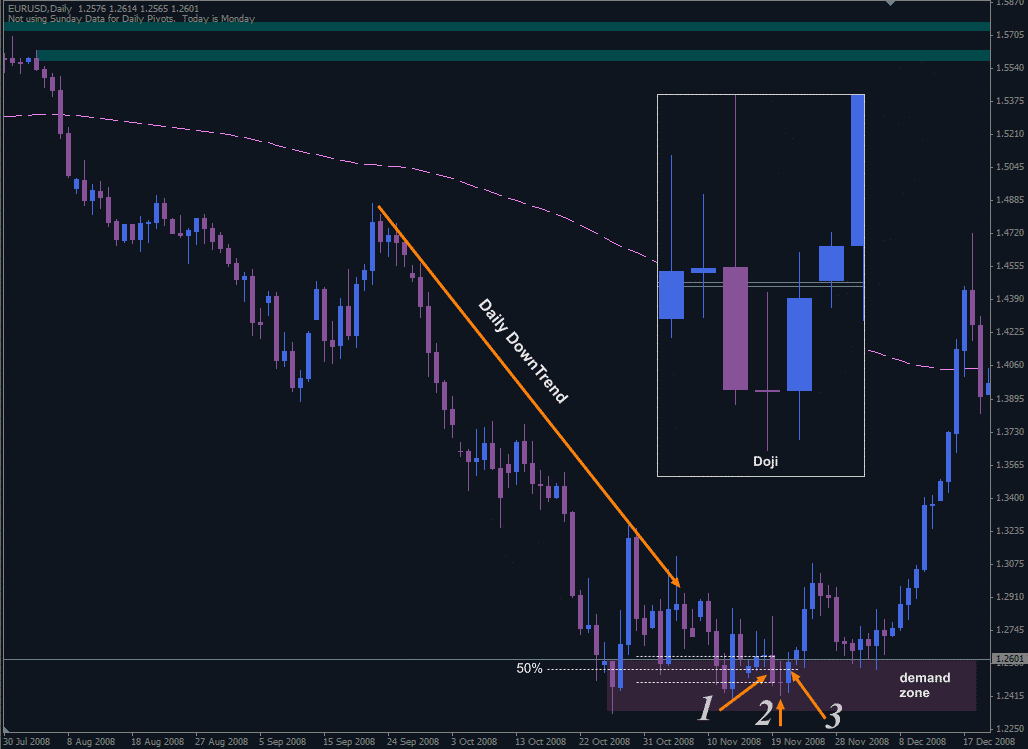
Another example of a good looking morning star candlestick pattern. Daily down-trend, largish bear bar, spinning top then to complete the pattern ample bull bar. Additionally, new demand zone established on completion of the pattern.
What about the formation at the top? Candles highlighted with dotted yellow box. Would you consider it as evening star? All good except the second candle doesn’t look like a hummer with long upper wicks or doji but it looks like a bear spinning top candle. Well, in this case it wouldn’t be much of an issue as we look to the left and see the price action and price hitting a fresh supply zone and bouncing from it nicely.
Morning Doji-Star
Same as morning star candle pattern. Only difference is we have Doji for the second candle instead hummer like candle with long lower wick.
This particular chart also demonstrate that down-trend reversal may take longer, even engulfing candle where demand established couldn’t do the job on this occasion. However, do not under estimate the power of the engulfing candle here. It shows us there are serious buyers at these prices. Additionally note that demand established with the engulfing candle.
Evening Doji-Star
Some may be saying, well there are no reference or indication on immediate left that other than evening doji star, which may indicate up-trend reversal. Then we go in higher time frames and look for important historical levels and price lines.
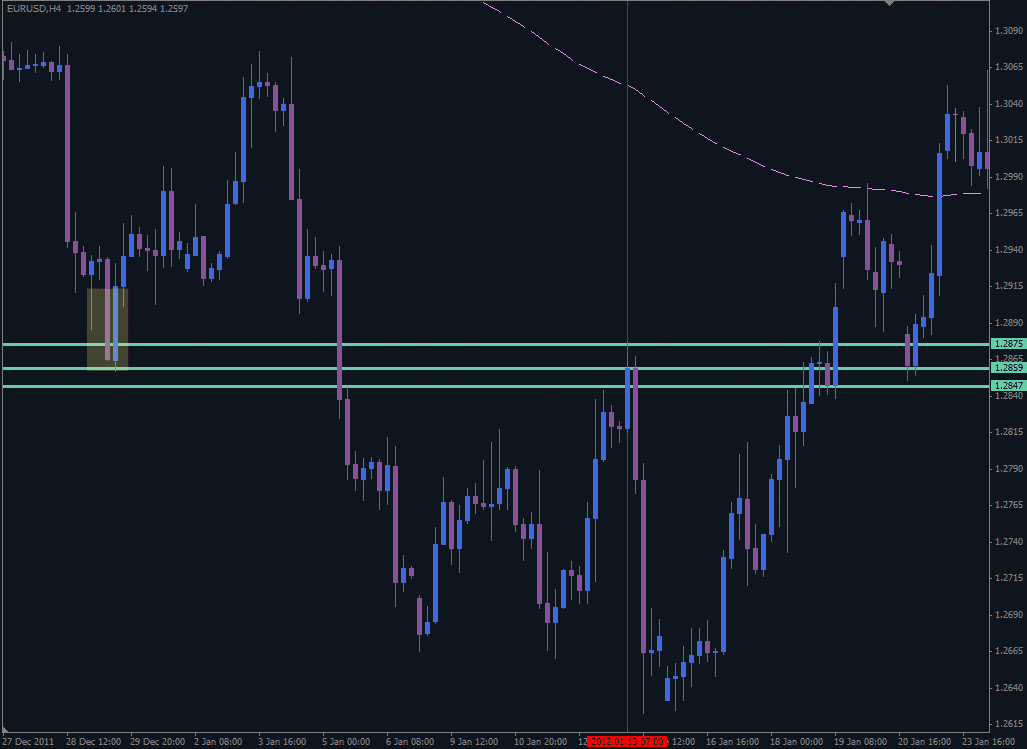
Here is H4. We see on immediate left possible reaction zone. Vertical red line drown on H1 doji candle.
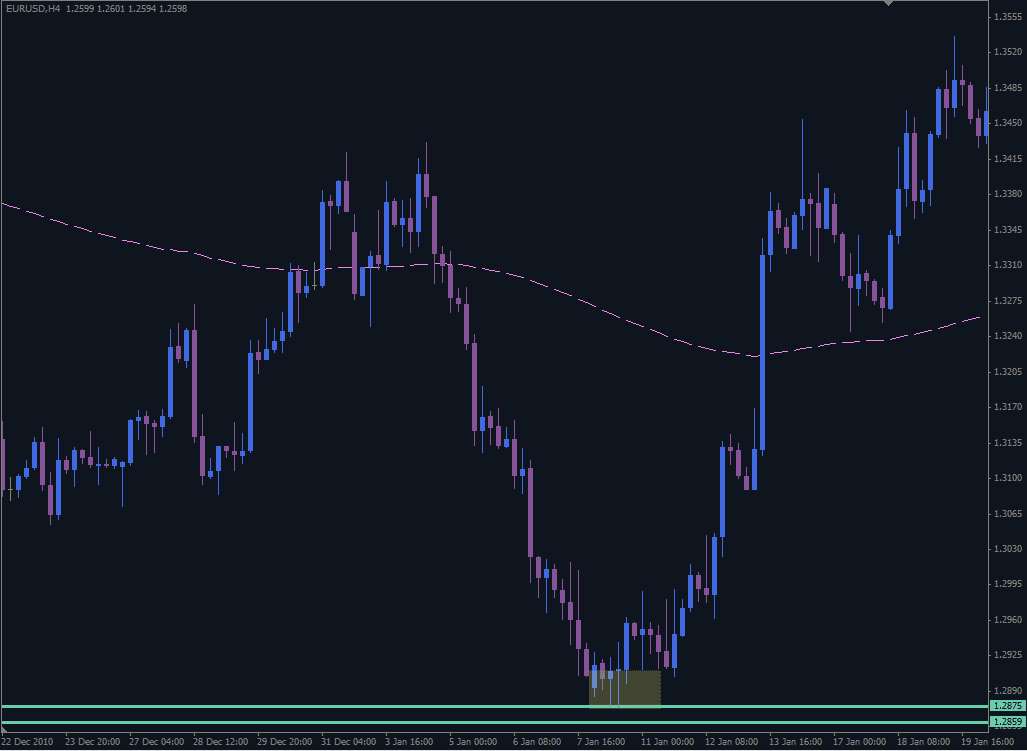
More further left of H4
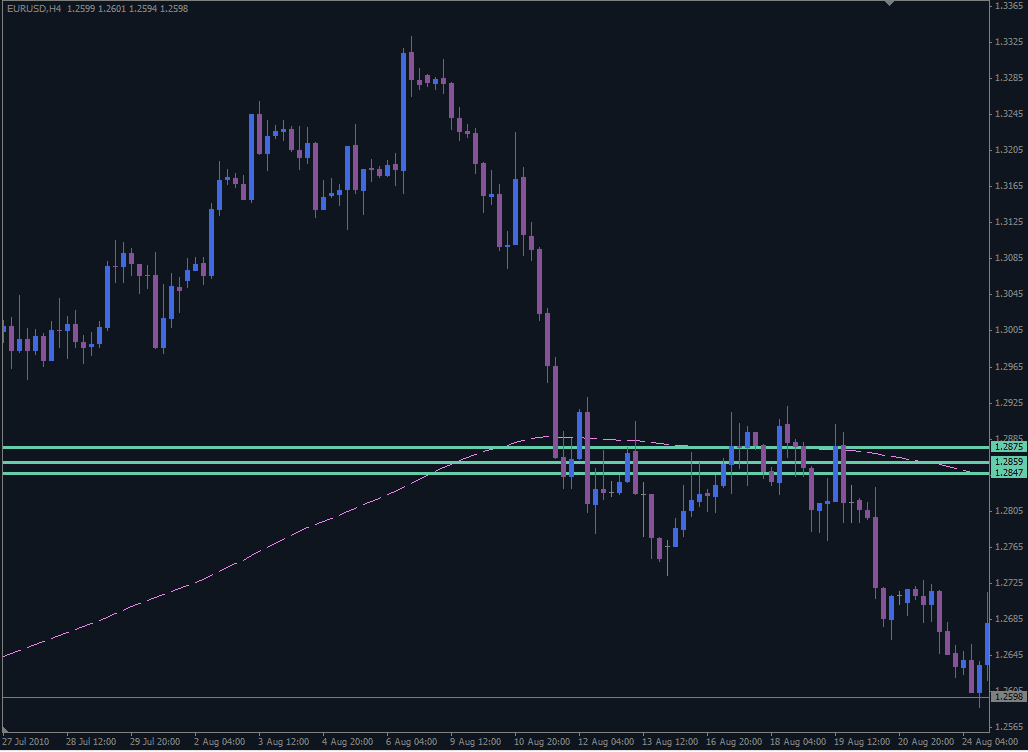
again……more further left of H4
Understanding how this forex reversal candlestick patterns become a good strong support resistance to get an accurate forex signals. In the next article we explain about Engulfing candlestick patterns.