
Trading With Fibonacci Retracement Strategy
Trading forex with Fibonacci retracement is very helpful for calculating the range before we decide to open a position. Fibonacci retracement is very important to calculate price level to retrace levels which have high probabilities price levels to bounce the price in order to continue price movement from the main trend. The Fibonacci retracement strategy needs to be combined with break out forex support resistance strategy then we draw Fibonacci retracement from a new fresh low or new fresh high to get retracement level to placed limit orders and add some Fibonacci extensions projection levels as our take profit levels. And also we can add reversal candlestick patterns as our confirmation trading signals. The main point in how we use Fibonacci levels is we need to wait first to support resistance breakout then we draw Fibonacci in the opposite direction then wait for the candlestick reversal patterns confirmed as our signals entry. The golden ratio from Fibonacci is 38.2, 50,0, and 61.8. So, on those Fibonacci levels, there’s a high chance to bounce the price. Stop loss can be placed a few pips from the 0.00 level of Fibonacci ratios. Moreover, we need to add some Fibonacci extensions as our swing projection that will be as take profit levels.
Fibonacci History That We Need To Know
A few hundred years ago, an Italian mathematician described that nature and numbers have a strong correlation. His name is Fibonacci. He introduced an interesting number sequence starting from zero and one (0, 1).
Take a look below, as we build a Fibonacci sequence:
0, 1
Now we perform the following calculation, where we add to the last number to the previous number in the sequence:
0 + 1 = 1
The result we get here (one) is the next number in the sequence. Thus, we now have the following:
0, 1, 1
Now we add the last number in the sequence to the previous number as shown below:
1 + 1 = 2
Then we add 2 to our sequence:
0, 1, 1, 2
We repeat the process of adding the last number in the sequence to the previous number:
1 + 2 = 3
…and the next one:
0, 1, 1, 2, 3
……and the next one:
0, 1, 1, 2, 3, 5
……… And the next one:
0, 1, 1, 2, 3, 5, 8
………… and the next one:
0, 1, 1, 2, 3, 5, 8, 13
We repeat this process as many times as we want!
Now you know how Fibonacci derived the numbers – 0, 1, 1, 2, 3, 5, 8, 13, 21, 34, 55, 89, 144, 233, 377.
Key Fibonacci Ratios
But what is so interesting about these numbers? As you probably guessed, the fun part begins now!
So, Fibonacci discovered the following: every number of this infinite sequence is approximately 61.8% of the next number in the sequence. If you do not believe me, let’s dive into the math for ourselves!
55 / 89 = 0.6179775280898876 = 61.8%
Wow! Let’s double-check!
233 / 377 = 0.6180371352785146 = 61.8%
Do you believe me now? No? Ok then:
144 / 233 = 0.6180257510729614 = 61.8%
I think this is persuasive enough!
However, this is not the only thing, which Fibonacci introduced. He also found out that every number in this sequence is approximately 38.2% of the number after the next one in the sequence:
13 / 34 = 0.3823529411764706 = 38.2%
21 / 55 = 0.3818181818181818 = 38.2%
55 / 144 = 0.3819444444444444 = 38.2%
144 / 377 = 0.3819628647214854 = 38.2%
And also, we have another ratio! Every number in the Fibonacci sequence is 23.6% of the number after the next two numbers in the sequence:
55 / 233 = 0.2360515021459227 = 23.6%
Note that these percentages can be retrieved from each number pair, which is part of the Fibonacci sequence, continuing to eternity.
Fibonacci Ratios Can Be Found Anywhere
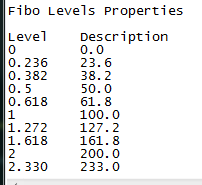
So, this is how the famous 61.8%, 38.2% and 23.6% Fibonacci levels appear.
This is the 76.4% level which is 100 – 23.6. But, what is so important about these percentages? The truth is that these ratios are all over the place in nature. Look at this several pictures below :
 |
 |
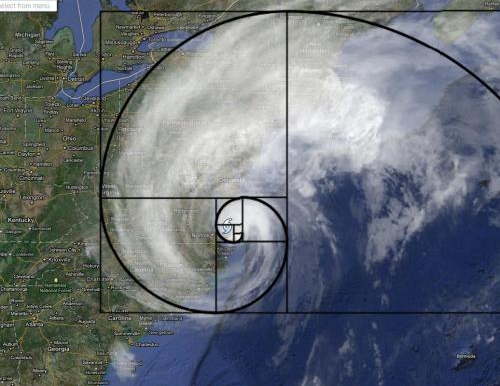 |
 |

How To Calculate Fibonacci Retracement Levels As Our Trading Levels-Based Support Resistance Strategy
As described in the first paragraph, how to get an accurate trading signal based on Fibonacci trading principles, I make simple trading using Fibonacci trading strategy from a daily chart in gbpusd based breakout support resistance confirmation.
Let’s take a look at the picture below: 😉
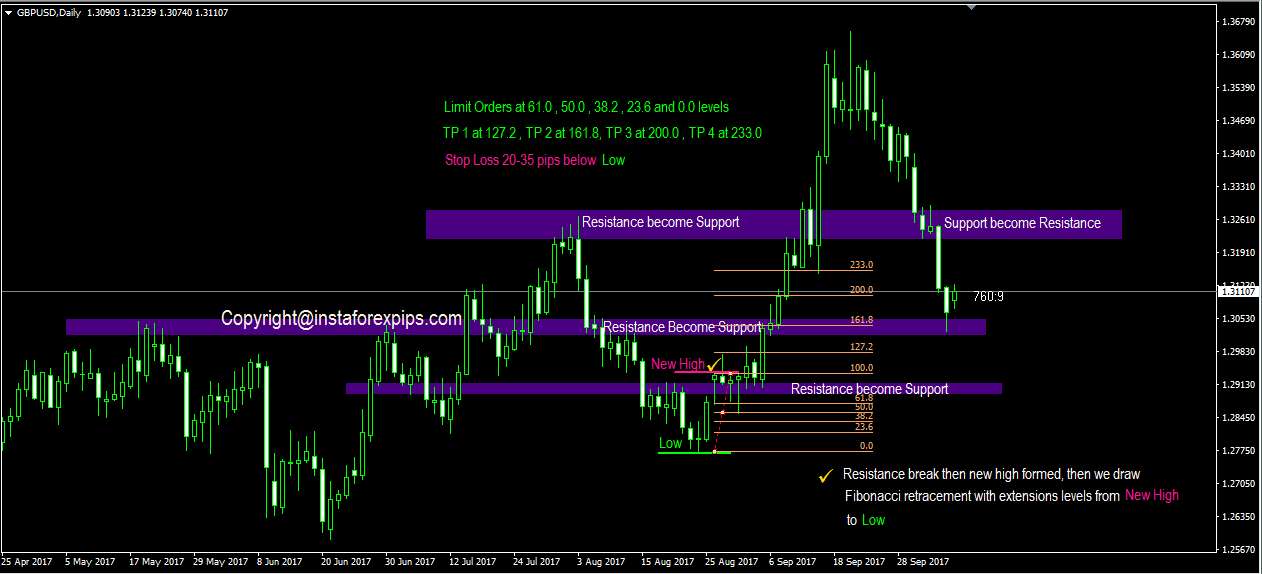
From the picture of the trading scenario above, we can see the nearest resistance of 1.29148 already broke out and made a new high or higher high which means a trend up just happened. Then draw Fibonacci retracement from the new higher high to the lower low and add Fibonacci extension levels as described in the picture below.
After drawing Fibonacci retracement which adds Fibonacci extension levels we can place pending limit orders on 61.8,50.0,38.2,23.6 and we hope on these levels there a reversal candlestick patterns. Reversal candlestick patterns or wicks as our rejection price can be seen in the current time frame or lower time frame. So, checked all time frames to find reversal candlestick patterns confirmation as our best trading signals. Once again wait until this reversal candlestick appears first. Stop loss can be placed several pips below the 0.0 level. And for take profit level 1 at 127.2, take profit level 2 at 161.8, take profit level 3 at 200.0, take profit level 4 at 233.0.
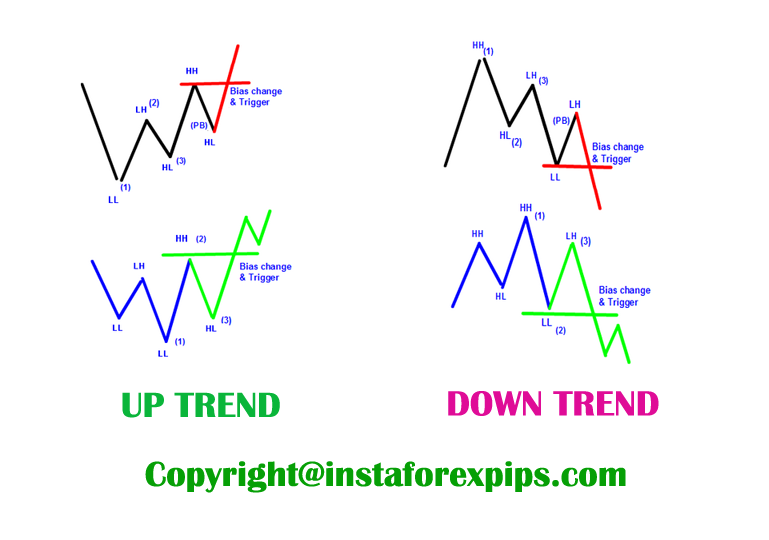
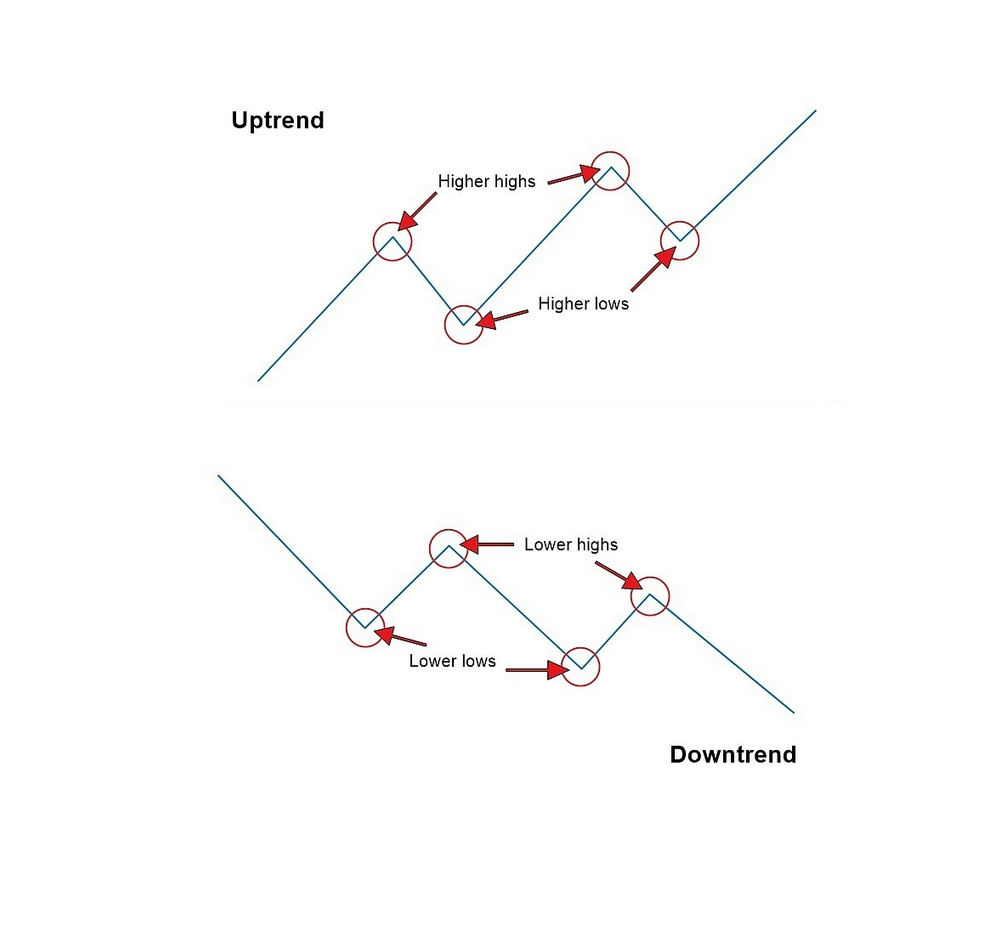
The basic principle to draw Fibonacci retracement is very simple, just follow the basic principle of price action trading strategy to determine a market’s trend. If there’s a first higher low then the price breakout previous lower high and making the first higher high trend up setups just happened and if there’s a first lower high then the price breakout previous higher low and making the first lower low so it means the trend down it’s just happened.
Based on the experience of senior traders, the limit for whether a trend will reverse or not is at level 61.8. Therefore it is called the golden ratio level. In other words, if a new high occurs then we pull the Fibonacci retracement from the swing low to the new high and then obtain the values of levels 50.0 and 61.8, and there we wait for a candle reversal pattern to occur or not, say bullish engulfing or bullish candlesticks patterns are formed at level 50.0 -61.8 and happens to be in an area parallel to support resistance, then the highest possibility is that the price will continue the up trend and possibly create a new swing high. However, if the Fibonacci swing high-level value is 50.0-61.8 and the support resistance level is parallel, there is no reversal candle pattern instead there is a breakout by a long candle body and the close body candle value is below level 61.8, then this means the trend will reverse into a strong downtrend. Vice Versa.
Combined this Fibonacci trading analysis with support resistance zone at least using a 4H time frame to increase our trading quality. See the pictures below to learn how simple price action trading setups help us determine the current main trend. Because we trade only follow the major trend right? trend is our friend right ?.
 After we can identify the current main trend with price action trading analysis, at least from now on we can be more confident to draw Fibonacci retracement to get high probability levels to bounce the price and can predict projection price in making swing low or swing high.
In my opinion, using a daily chart or 4H time frames is much better to start analyzing current major trends before making any trading decisions. So, step by step Drag Fibonacci retracement from the swing low to the new swing high,(in case of an uptrend), then after getting levels 50.0 and 61.8, see if in the left there is a support resistance level or not, if there is previous support resistance in equal with levels 50.0 and 61.8, so it is a valid zone as maximum retrace level. The second step is the go to a smaller time frame m15 -H1 and wait on these levels 50.0 – 61.8 of Fibonacci retracement that we got from a big time frame, whether a reversal candlestick pattern or price action signal confirmation is formed or not. If this happens, we will get the best buy signal momentum, and if it breaks, it means the major trend is changing from an uptrend to a downtrend. Vice Versa.
Therefore, to get the fastest signal momentum, we have to look for confirmation in a small time frame as the initial and fastest confirmation. Confirmation of signal momentum that occurs at a small time must remain at the Fibonacci retracement level 50.0-61.8 obtained from the large time frame (H4-Daily) regardless of whether it is a swing high or swing low.
Confirmation signals on small time frames can be many rejection wicks or shadows, or reversal candlestick patterns, and price action confirmation signals (Change of Characters). Here a tutorial for what is price action signal confirmation is which combines it with multi-time frame analysis.
Lastly, practice on a daily first then look at the best signals entry in a four-hour time frame, because daily are stronger or non-lagging analyses which are used as our first indicator to start trading forex. With the Fibonacci strategy method, we can calculate the price with maximum swing and get reversal entry levels to minimize our risk of trading.