Category Archives: Candlestick Basics
Technical Analysis Forex Trading With Candlestick Patterns
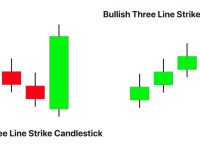
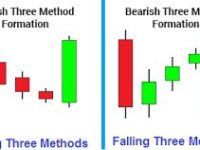
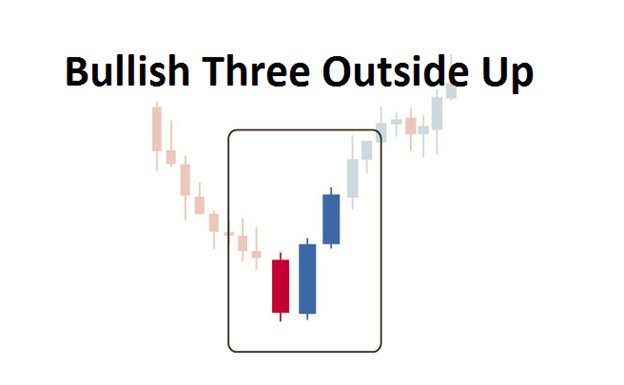
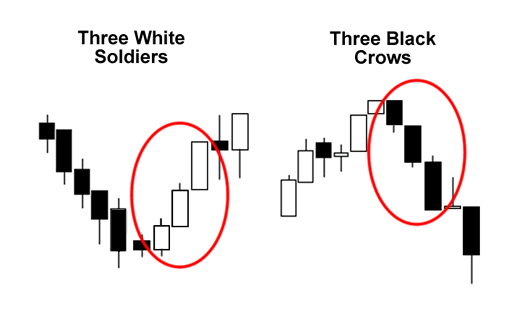
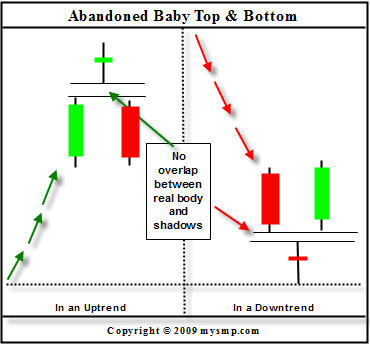
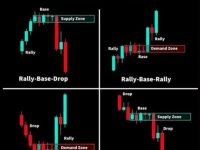
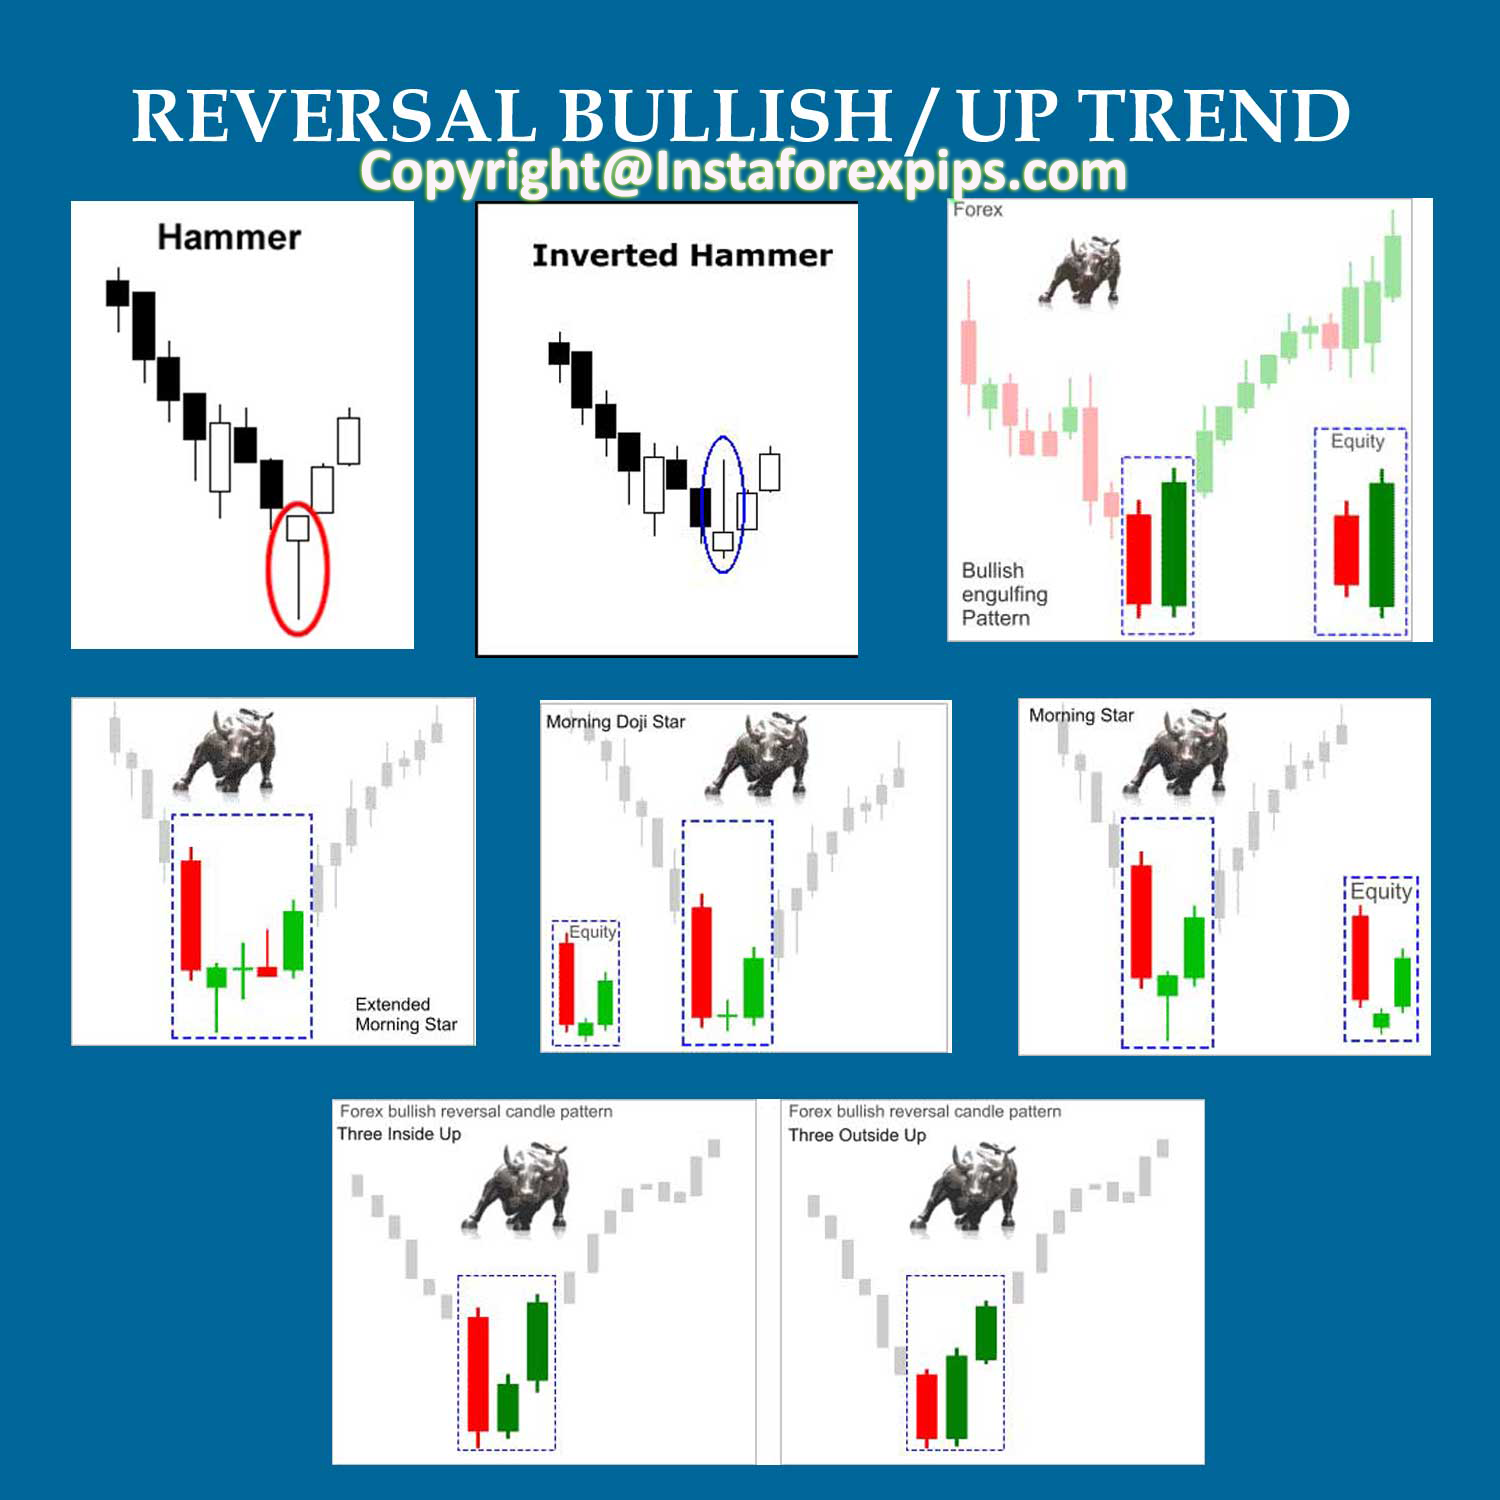
Easy Forex Using Candlesticks Patterns
One of the top professional forex trading always using basic technical analysis forex trading with candlestick patterns. This standard analyzing usually using daily and four hour time frame. So we can trading with flexible time and no need stay in in front of your laptop or your pc all day long or all night long. Don’t waste your time because forex!! is it right? I think your answer the same with me. We should learn and practice using daily and four hour price action trading strategy beside this forex basic learning e-book.
Continuation Candlestick Patterns – In-Neck On-Neck & Thrusting
Bearish In-Neck, On-Neck & Thrusting Continues Patterns
Strong continuation On-Neck – Medium Continuation In-Neck – Weak Continuation Thrusting
We look for these bearish patterns in a down-trend within the context of continuation pattern. Don’t forget, this is not a reversal pattern but a continuation one. These patterns consist of two candles.
Three Line Strike Continuation Candlestick Pattern
Bullish/Bearish Three Line Strike Candlestick Pattern
Bullish Three Line Strike Candle Pattern [weak]
We look for Bullish Three Line Strike candlestick pattern in an up-trend within the context of continuation pattern. Don’t forget, this is not a reversal pattern but a continuation one. The pattern consist of four candles.
As a continuation of the established up-trend, first we see three bull candles resembling bullish three white soldiers or simply 3 up. Each bull candle should close higher than previous candle.
The last candle of the pattern is a long bear one. It closes around or below the first candle open.
Continuation Candlestick Pattern – Raising And Falling Three Methods
Today’s article is about raising and falling three methods from continuation candlestick pattern. This continuation candlestick pattern is very important on reading psychology of market cycle that we can apply in our trading rules.
Raising and Falling Three Methods Candlestick Patterns
Bullish Rising Three Methods And
Bearish Falling Three Methods
Bullish Rising Three Methods
Reversal Three Inside – Outside Up and Down Candlestick Pattern
Bullish Three Inside Up – Three Outside Up
We look to see these patterns on a down-trend.
Bullish three inside up candlestick pattern:
Last candle of the downtrend is a large bear candle. Of course we don’t know at this point if it’s a last candle of down-trend. We can re-phrase it by saying the first candle of the three inside up candlestick pattern is a large bear candle on a down-trend.
Reversal Three White Soldiers & Black Crows Candlestick Pattern
Bullish – Three White Soldiers Candle Pattern And
Bearish – Three Black Crows Candle Pattern
![]() |
![]() |
We have another couple of reversal candlestick patterns with an interesting names. While the bullish version of the same pattern named as a white soldiers, the opposite of version called not 3 black soldiers but 3 Black Crows. I guess they tried to avoid any possible tone of racism. Well, if I was naming them I’d have used for bullish version 3 Brave Soldiers and bearish version 3 Rebel Soldiers if were to stick on with soldiers theme. Perhaps more simpler approach would have been better by just naming them 3 Up Pattern and 3 Down Pattern.
Abandoned Baby Candlestick Pattern
Bullish and Bearish Abandoned Baby Candle Pattern
Lets start with engulfing pattern which is considered to be most strong of all in the right place.
Who’d want to abandon their baby? I don’t think many people does it. Similar situation applies to markets when it comes to Abandoned Baby reversal candlestick pattern. It’s appearance is pretty rare on trading charts but once it appears in a correct place [zone] it’s considered to be quite a reliable indicator of the trend reversal.
Bullish And Bearish Engulfing Reversal Candlestick Pattern
Bullish / Bearish Engulfing Candlestick Patterns
Remember in using this engulfing bullish or bearish candlestick pattern that should be located on supply demand zone. Lets start with engulfing pattern which is considered to be most strong of all in the right place.As it’s a reversal pattern, Engulfing candlestick pattern is most beneficial when there is a up or down trend. It’s for identifying the turning/reversal point. It’s kind of recognizing top or bottom of given up or down trend move. Trends we are talking here is Time Frame specific. You may have many mini trends withing the scheme of larger trends and therefore as you breakdown larger trend there will be many more turning points of mini trends in a smaller time frames.
Supply Demand Trading Concept With Continuation And Reversal Candlestick Pattern
Supply Demand Trading Concept Still Need To Be Filtered With Candlestick Patterns
Forex trading sometimes is very complicated.Even some traders loss almost their all saving money. Why it can be happened? It’s because some traders only using their emotion on their analysis and forget about money management and off course 90% traders using their instinct. As we know the core of economy market is supply demand. Because of this we have to concern about this supply demand trading concept, but remember this supply demand trading concept still need to be filtered with knowledge about reversal and continuation candlestick pattern. An this candlestick pattern have to be located on supply or demand zone, so not between on supply demand zone. So with knowledge about this candlestick pattern which located on supply demand zone, we can read the power of seller or buyer will remain.
Candlestick Basics That We Must Understand
Let Candlestick Tells On Us About The Price
From our experience in trading forex, this candlestick patterns cannot be forget from our variable analysis. This candlestick basics can be read on best time frame at least on four hour time frame. Why have to read on four hour timeframe ? because this four hour time frame give us the best parameter to get strong support resistance zones or even better read based on daily time frame so it will get a accurate trading signals to enter the market which still have to be filtered by candlestick pattern from daily time frame. So, to read strong support resistance or strong level entry have to be done from D1 timeframe and looking the best momentum on H1-H4 timeframe. This is exactly what we do on every our analysis before made some open position.