Three Types of Forex Charts
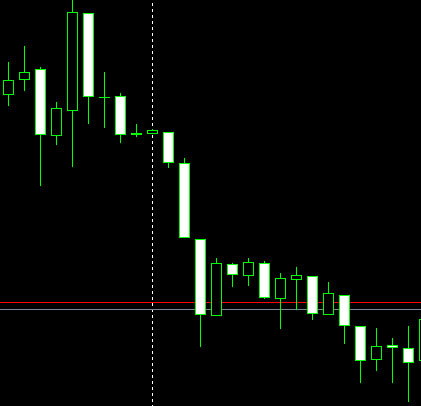
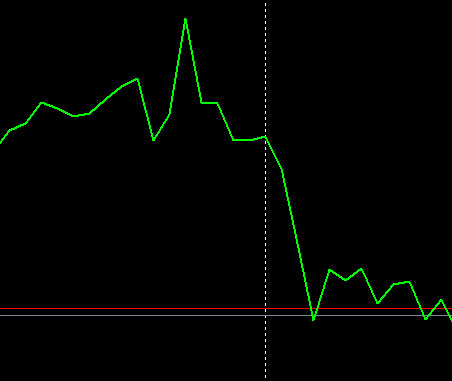
There are three types of forex charts. The first is Barchart, the second is candlestick, and the last is linechart. See the pictures below:
Here are sample pictures to see on each type from the Forex chart :
 |
 |
 |
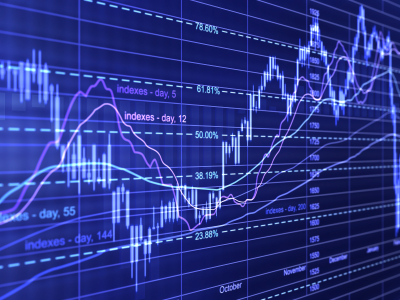
The common picture of the Forex chart below :
How To Read Forex Candlestick Charts
Here is details specification of the anatomy candlestick below: 😉

In 1700 Japanese rice traders developed a candlestick strategy in market analysis. Until now many professional forex traders traded with this candlestick patterns strategy. As a beginner in forex, we should understand first how to read market structure-based forex price action strategy and candlestick patterns analysis. So we can learn about the gap price or liquidity forex trading strategy too. After we’ve read many pdf from forex e-books about this candlesticks analysis, we found only 4-5 most profitable forex candlesticks patterns that we used as our support resistance zones at this reversal forex candlestick patterns should be used at least in the four-hour time frame above. Daily or weekly it more better.
Those fifth reversal candlestick patterns are: engulfing, morning/evening stars, hammer, shooting stars, hanging man, and inverted hammer. Use those candlestick patterns as our support resistance area in a four-hour chart or daily chart then look for the price action signals confirmation in m15 until one hour time frame. So in reading candlestick patterns we still need multi-time frame analysis to prevent lagging signals.
The basic concept of technical analysis is how we read the true support resistance area. There are many ways to read support resistance. One of my favorite ways is using reversal candlestick patterns as our true range of support resistance.
My tips read support resistance that has 2 reversal patterns appear in one range. It means there should be valid bearish reversal patterns and valid bullish reversal patterns and there are a winner buyer or seller patterns. That’s the way I read true support resistance levels.
See the sample picture below :
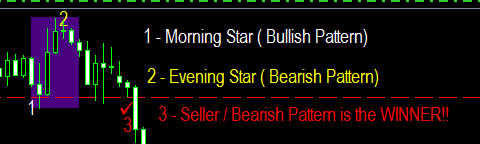
From the picture above we can see true resistance already appears and the area is from the low bullish pattern of the morning star and the high bearish pattern of the evening star. That area as our true resistance is valid because the winner is already done.
You can add a combination of fundamental analysis from leading and lagging economic indicators to measure how strong the trend will go. Once again economic news is our economic indicators reading as strength of current major trend only so not for the confirmation signals.
Practice first using this candlestick strategy then you’ll trade like a pro.
In the next article, I’ll share how to use candlestick forex chart patterns as our base analysis. For many years successful forex traders always used price action forex based candlestick forex strategy to get the ultimate profit each month.
Last but not least, use the best forex brokers that we recommended in the listing below. My real account uses ROBOFOREX, IC MARKETS, EXNESS, HFM, and TICKMILL. Once again looking at the confirmation trading signal in an hour time frame the forex signals usually appear in support resistance area-based bearish and bullish that appear in one range which getting from at least 4 hour chart.