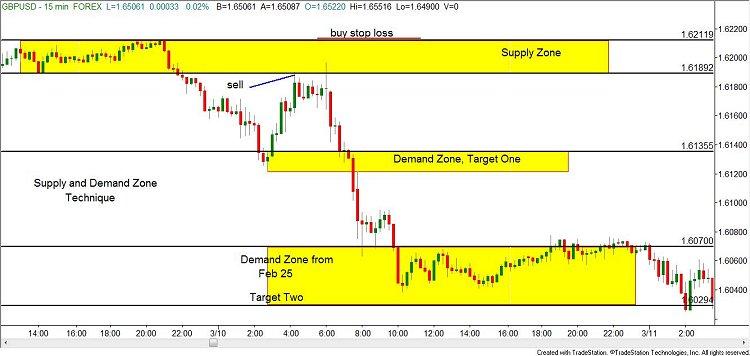
 Why this supply demand strategy is easy to follow even for a new comers in forex market ? Is because we only know to read supply demand broken or not. This supply demand concept is simple. Buy if nearest-up demand area are broken and sell if nearest-down supply area is broken. Just like that. This system of supply demand is set and forget trading techniques as long as you are using supply demand level from big picture like daily, weekly or monthly. You can using this supply demand strategy on swing which it takes a hundreds pips more or only intraday which getting pips below 100pips. It’s all depending on what time frame you’re using as identify supply demand zone.
 An area of supply or demand is not just a single price/line (like classic support/resistance), but a zone/area composed of a number of pips. The highest part of that (rectangle) is the distal line, that is, the highest price in the zone. The lowest part of that rectangle is the proximal line, which is the lowest and the closest to current price.
- The closer you are to the a supply area, the better for selling or exiting your long positions
- The closer you are to the a demand area, the better for buying or exiting your short positions
 |
 |
The sole purpose of this spreadsheet is to allow you to know how high or low you are in the D1 and WK supply and demand curve if you manually add the distal and proximal lines for both D1 and WK SD levels on your charts, or whatever time frame you want to use as the curve (demand and supply in control of current price).
All proximal and distal lines prices are manually entered, you can change them and the spreadsheet will do all the calculations for you. Levels might differ depending on brokers and of course depending on what you consider to be the demand and supply areas in control of price at any given moment.
Drawing supply and demand levels can be considered an art. You might see levels everywhere if you are new to supply and demand, with time you will have to create very simple and strict rules to filter the bad ones out as much as possible.
FRESH LEVELS versus ORIGINAL LEVELS
Supply and demand levels can be:
- Fresh. Price has not pulled back yet, untested level
- Non-fresh. Price has pulled back to it at least once
- Used up. Price has pulled back to level several times, not good for trading
- Original. Level has been created out of the blue, not being a reaction to any previous level
- Original and fresh. Same as original, but it’s fresh (untested)
How do we know if we have an original level of supply? (opposite for original levels of demand)
- Look left to find original levels
- Draw a horizontal line at the distal line, and scroll your charts UNTIL you see that it touches a candle
- If that candle is part of another supply level, then the supply level you were analyzing is not original
- You are not allowed to cut through candles, that is, once you look left by drawing the horizontal line and the line meets a candle, you stop and decide if it’s a reaction to a previous supply level
- To know how original a level is you need to look left because you need to look at the origin of the level
WE NEVER CUT THROUGH CANDLES TO FIND SD LEVELS, A FLIP ZONE IS NOT A LEVEL
How do we know if we have an fresh level of supply? (opposite for fresh levels of demand)
- Look right to find fresh levels
- Draw a horizontal line at the proximal line, and see if price has touched the level
- If price has not pulled back to the proximal line then it’s a fresh level
- Freshness of a level is known when you look right, you have to see if price has pulled back into the level or not
When is a supply or demand level confirmed as a level?
- We need that the opposing supply/demand area is taken out (absorbed) before we consider an area to be valid AND/OR price making Higher Highs or Lower Lows in the time frame where the level is being drawn
- If previous opposing area is not taken out AND/OR price is not making HH or LL, the new level will be negated
- For instance, if we see a D1 demand forming, we’d require that at least one full candle (OHLC, Open, High, Low and close) closes entirely above the potential D1 demand basing area in order for that demand area to be considered as demand, otherwise it will be considered part of the base
- Exception: if we are at the extremes in the curve (D1 demand fresh zone, it does not apply to non-fresh zones) we won’t need that the new lower time frame demand (H1 in this case) takes out previous H1 supply area for our entries, since the D1 demand is fresh. If the D1 demand was not fresh then we’d need that previous supply be removed before the brand new demand is considered for a confirmation type of trade
When do we consider a zone to no longer be valid? When is it considered to be broken and needs to be removed from our charts?
- The zone is no longer valid when it’s been taken out by as little as 1 pip
- We don’t wait for a close above or below the zone in order to consider a zone as a violation
- We don’t wait for a full OHLC candle above/below the zone
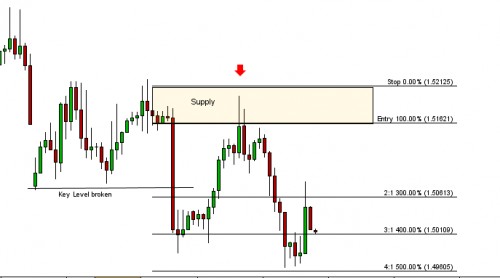
Sometimes, we’ll have zones overshot by a few pips, others by quite a bunch or pips and we’ll see it dropping/rallying after that, most likely after our Stop Loss has been hit. If that is the case, a brand new level might have formed confirming willing buyers/sellers, which could be good for a trade once it pulls back to retest it by using the confirmation type of entry.
Free naked trading pdf can be read too as our references for our trading journey.
Set & forget is got its pros and cons! Sometimes levels will be overshot by a few pips, this is why having a nice wiggle room added to your SL is key. Market makers are lurking in the dark like hyenas. Others your SL on a short will be hit and then price will drop like a rock. You will not want to short that pair any more because you had a loss the first time, but what will most likely happen then? The second entry was the good one and you didn’t take it because the first one was a loss!
Does it ring a bell to you? We need to add more wiggle room to the trades at the extremes, we should not be scared to take a second trade if the first one was a loss.
BUY LOW, SELL HIGH (in the curve or range)
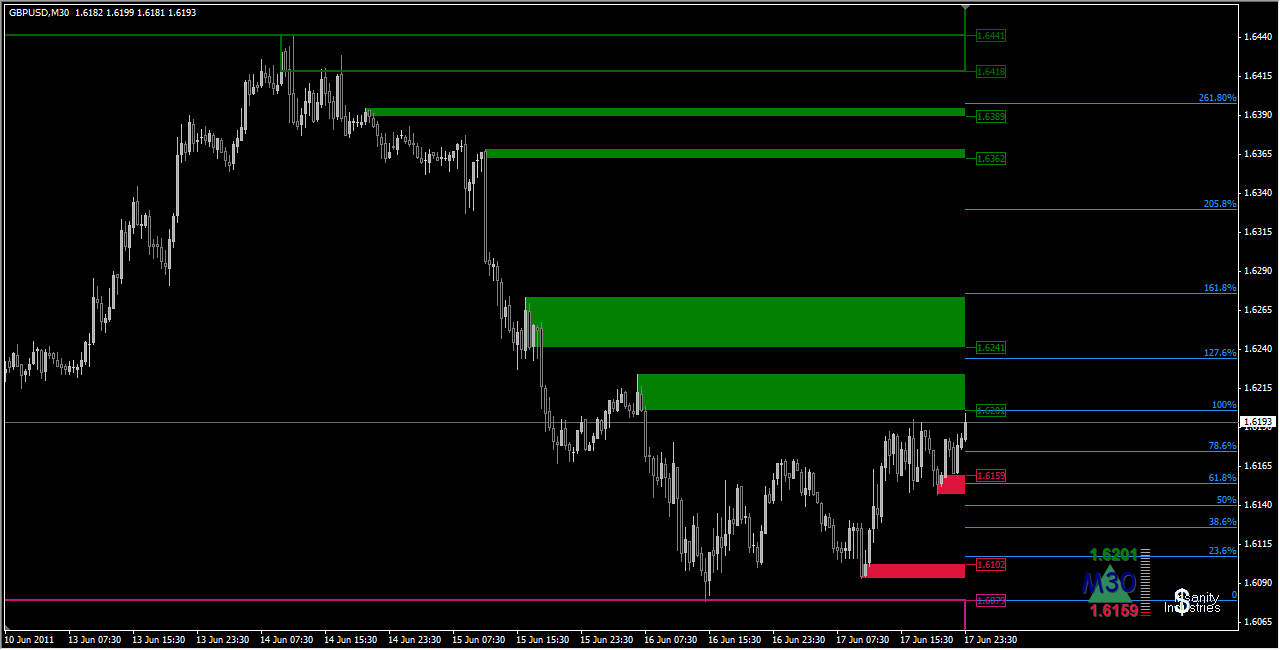
Assessing when a trend has changed is one of the trickiest things a trader will face, because every time frame has its own trend. You may be trading in an uptrend on H1, but the D1 is in a downtrend, and the weekly in an uptrend. So, the first thing you need to do is to decide which is the time frame you will be using for your trend, and follow it 101%, don’t switch it randomly, use always the same one. Then choose the entry time frame where you will be drawing your entry SD levels; after that, define the time frame to assess how high or how low you are in the Curve, it will tell you if you are too high to buy or too low to sell, so you will be more or less aggressive in picking up levels or your Take Profit (exits). You can use the spreadsheet I created for Open Office Calculator to manually add your D1 and WK levels, by doing so you will always keep track if you are too high or too low in the supply and demand curve. If you are too high in the curve, you should be thinking of exiting your longs and looking for supply zones to lean on your shorts if you think that are maybe a turning point in the current trend; opposite for low in the curve.
You can see that spreadsheet in the following link, levels are not updated (I do it every day for personal use), but it’s better like this because you will see all the color changes that will be helping you to assess if a level has been hit, if its been penetrated 50% or it’s been broken. Thread about this supply demand forex trading technique with clean charts read more details visit here.
Use the screenshot below as a guidance to mechanically know how high or low you are in the curve. Decide the % you will consider as too high in the curve (how close you are to higher time frame proximal line), and don’t go long if price is higher than that %. Do the same for the low %. Decide upon that and don’t break the rules, you will avoid many losses by doing so.
Here some details explanation about this multiple time frame analysis from this supply demand strategy :
1.SWING TRADING CONFIGURATION:
Time frames combination for medium-term setups.
- BIG PICTURE time frame: Weekly chart as our supply/demand curve
- EXECUTION and trade management timeframe: H4 chart
- This is the chart where we should draw and pick our levels up, where we will set our limit orders. If the H4 level is too wide, we can drill it down by using either a fix number of pips (for instance a 40 pips on EURUSD for H4 charts) or a third time frame to fine tune our entry. I will not zoom in and look for levels on lower time frames above or below that area because it’s the H4 area that interests me, if the level itself is on H4 then I have to base my decisions on this time frame, the one I use for my entries as defined here. Otherwise we’ll end up chasing the trade and finding what we want to see on the charts, not what the market has to offer us at that particular area
- This is also the chart where we will manage our trades, we’ll use technical SL to move our SL above/below new H4 SD areas.
2. INTRADAY TRADING CONFIGURATION:
If we choose to use H1 levels as your entry time frame, then we will switch to this timeframe combination:
- BIG PICTURE time frame: Daily chart as our supply/demand curve
- EXECUTION time frame: H1 chart
- This is the chart where we should draw and pick our levels up, where we will set our limit orders
- This is also the chart where we will manage our trades, we’ll use technical SL to move our SL above/below new H1 SD
VERY IMPORTANT: CONCENTRATE ON ONE SINGLE TIME FRAME COMBINATION
-
- Choose only one of the combinations described above, either Intraday, Swing or Position trading, AND stick to it.
- Hide the time frame buttons you are not going to use on MT4 top toolbar, only be aware of those you choose, that’s all. You will see that in short you will start improving because your mind will not have to take into account so many time frames and information.
Normally there will be D1 SD areas within a Weekly SD area. So concentrate on at least 2 time frames, choose the combo you like the most. D1/H1 for intra swing trading, and WK/H4 for longer term swing trading, and don’t even look at the other time frames
- Use the trend line idea you can watch on the videos, use the Supply and Demand spreadsheet I created, as well as the rectangle extender indicator, that should put you on the right track in a few weeks.
And the most important thing, this is KEY. JUST DO IT! Don’t find excuses not to do it, hide those TFs you are not going to use and concentrate on those you use only, the D1/H1 is a VERY powerful combination, start with that one and HIDE all the other time frames, that should help you and others with your same problem a LOT.
You MUST have very strict rules or you will be lost in a loop, and your equity will not grow. 95% of your success is at controlling your emotions and managing your exits correctly, the entries are not the problem, the exits and your head are And that can be solved by having very strict set of rules and following them. The key to be consistent is by being consistent.
Here is How To Read Market Structure [Advanced]
In the next article, is about trading position in curve supply demand strategy based weekly for swing traders and daily for intraday traders.