Bullish and Bearish Abandoned Baby Candle Pattern
 Lets start with engulfing pattern which is considered to be most strong of all in the right place.
Who’d want to abandon their baby? I don’t think many people does it. Similar situation applies to markets when it comes to Abandoned Baby reversal candlestick pattern. It’s appearance is pretty rare on trading charts but once it appears in a correct place [zone] it’s considered to be quite a reliable indicator of the trend reversal.
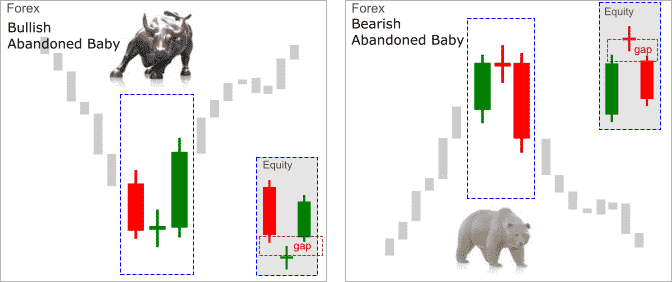
Most of the online sites describes Abandoned Baby that appears on equity market charts. Let’s make it clear again, Abandoned Baby candle pattern like many others is different to ones we may see on Forex charts. The key difference is the gap required for equity markets Abandoned Baby candle pattern while it’s not the case for the 24 hours traded Forex markets, unless, somehow it appears with a gap on market opening after the weekend break.
Remembering that Abandoned Baby Candle Pattern is a trend reversal one, bullish Abandoned Baby Candle Pattern appears at the bottom while bearish Abandoned Baby Candle Pattern appearing at the bottom.
Of course we don’t know when that top or bottom may be establishing. In general terms in Financial markets there is no such a thing as bottoms and tops. We can only define them once established on any given time frame charts not as a whole market for any instrument. Just like trends, unless you specify time a time frame asking such question as “What’s the EUR/USD trend?” would be meaningless.
As always we look and see if the Abandoned Baby Candle Pattern appears in and around any significant supply and demand zones.
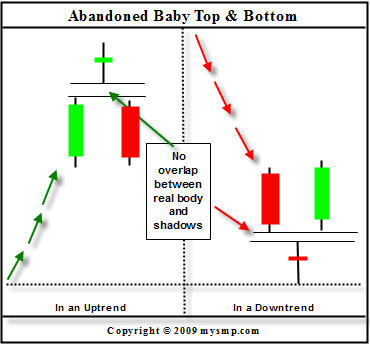
The above illustrations give pretty clear idea about what Abandoned Baby Candle Pattern may be looking like on our trading charts.
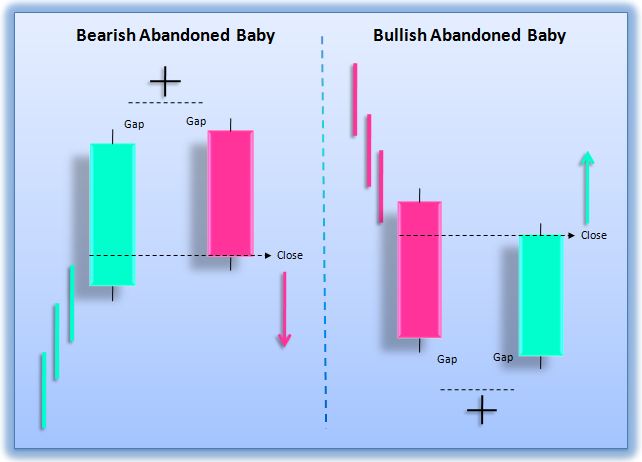
Bullish Abandoned Baby Candle Pattern
- Appears on a down-trend when price reaches significant lows. We wouldn’t be looking for this pattern on an up-trend.
- First bar of the pattern is as continuation of the current trend which would be a bear bar/candle. It’s noticeably a largish bear candle with a smaller wicks compare to it’s body.
- Second candle forms as a doji where opening and closing prices of the candle almost the same. We see buyers start to show their hand but it’s inconclusive at this point as they are not able to take control at this point. It may be bear or bull doji.
- Third candle is a strong bull candle with smallish wicks compare to it’s body, where we can see buyers gaining the control. Third candle needs to penetrate well into first [bear] candle and in some cases above.
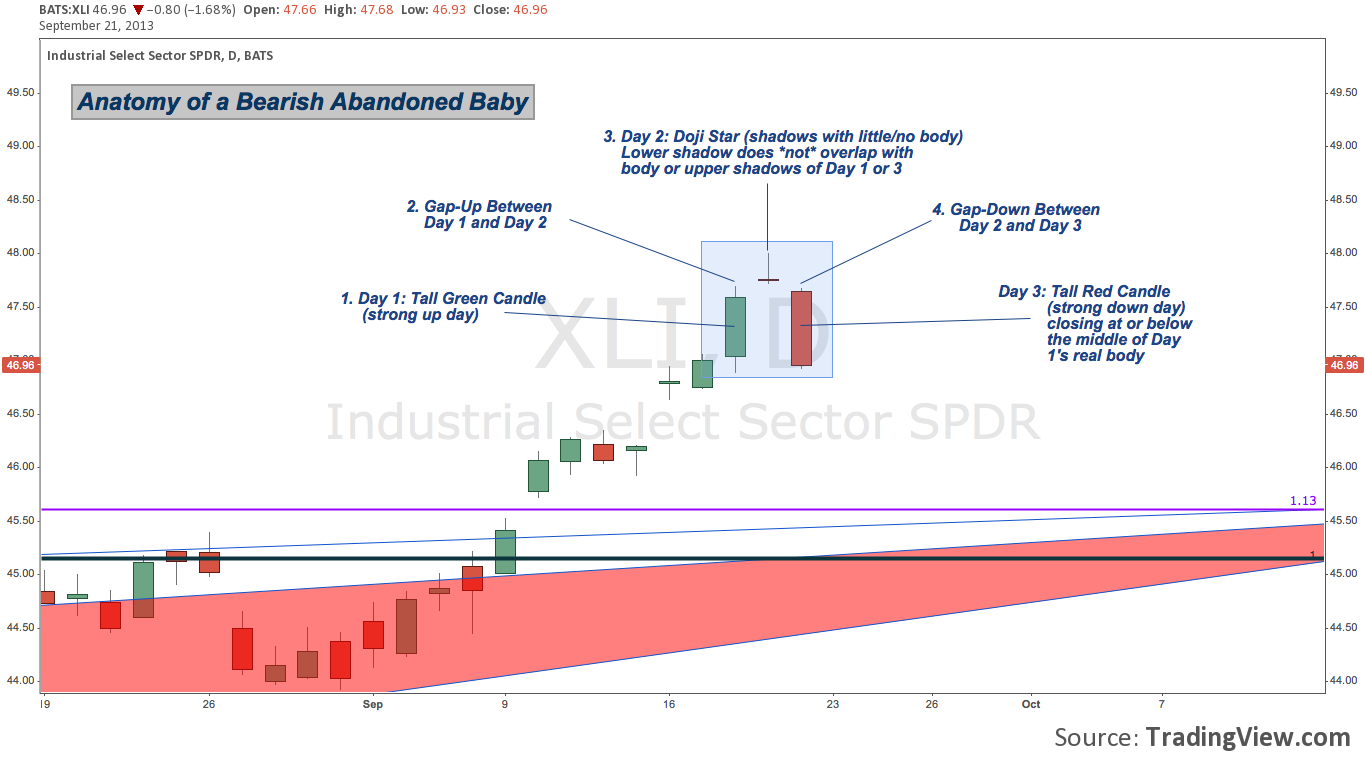
Bearish Abandoned Baby Candle Pattern
- Opposite the bullish version. Just reverse the logic and you’ll have the description of Bearish Abandoned Baby Candle Pattern.
You’ll also notice that Forex Abandoned Baby Candle Pattern is almost identical to Morning/Evening Doji Star Candle Pattern [See here]. There are not much to separate these two candle patterns. Therefore it’s more of an insufficient equity markets candle pattern with it’s full implied meaning – abandoned [gap is the cause of abandonment]
Here’s some example below from bearish and bullish abandoned baby reversal candlestick pattern.
The next article from this reversal candlestick pattern is Three White Soldiers & Three Black Crows Candlestick Patterns.