Bullish Three Inside Up – Three Outside Up
We look to see these patterns on a down-trend.
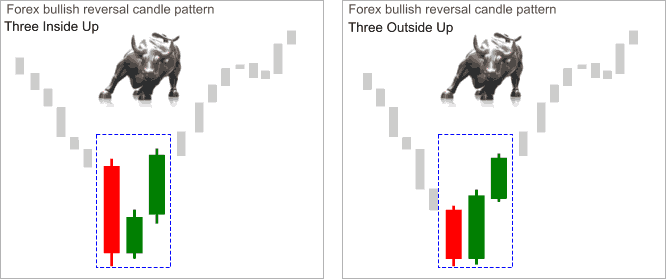
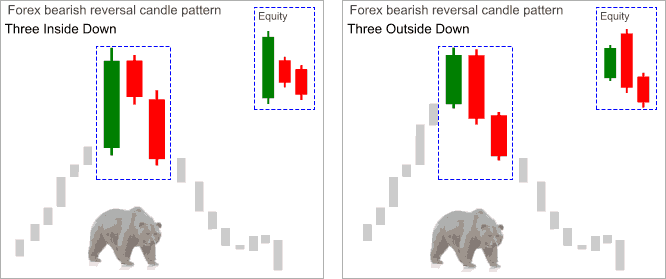
Bullish three inside up candlestick pattern:
Last candle of the downtrend is a large bear candle. Of course we don’t know at this point if it’s a last candle of down-trend. We can re-phrase it by saying the first candle of the three inside up candlestick pattern is a large bear candle on a down-trend.
Buyers at this point show interest to the prices at this level and starts buying and we have a bull candle as a second candle.  The bull candle manages to penetrate about halfway inside the bear candle.
At this point buyers are quite confident and continue buying in bigger scale. We end up having an another bull candle taking out largish bear candle by closing above it. This part is important. Second bull candle must close above the bear candle which is the first candle of the pattern.
One can also say that first the candle of the pattern is a simple Harami pattern. Harami shows us the interest of buyers at these levels but Harami pattern itself is not enough to commit. Most traders wait for confirmation before buying. The third candle of three inside up candlestick pattern provides that confirmation.
Buying on close of third candle may not be such a good idea at all times. There may be some profit taking after the third candle which may offer better entry opportunity.
Bullish three outside up candlestick pattern:
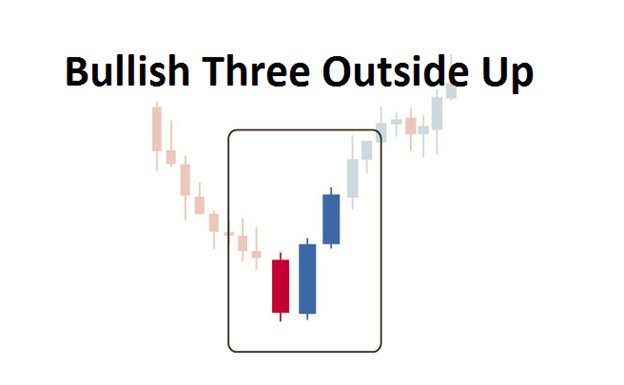 The first candle of the three outside up candlestick pattern is a largish bear candle on a down-trend.
Buyers at this point show interest to the prices at this level and starts buying and we have a bull candle as a second candle. Like in three inside up pattern, the second candle closes as a bull candle but unlike it closes well above the first candle [bear] of the pattern.
At this point buyers are quite confident and continue buying in bigger scale. The third candle again is a bull candle and closing well over the previous candle close.
When we see three outside up candlestick pattern, it may be one of the better opportunity to buy. As you can see, first two candles themselves already created a nice two candle pattern we know as a engulfing; in the case of the above illustration bull engulfing candle pattern.
Use In Trading
The bullish three outside up pattern can occur in a number of different contexts (e.g. at the beginning of a trend, during a trend, at the end of a trend, etc.), but it is most relevant when it occurs during a significant downward trend. The bullish three outside up pattern is a bullish pattern, and can be used as an indication of the end of a downward trend. The bullish three outside up pattern is a somewhat complicated candlestick pattern, but once the important elements of the pattern are understood (e.g. the second candlestick containing the first candlestick), the pattern is relatively easy to identify on a price chart, and the pattern can provide a useful indication of upcoming price movement.
Bearish Three Inside Down – Three Outside Down
We look to see these patterns on an up-trend.
Bearish versions of the above Three Inside Up – Three Outside Up. Only difference is these are formed opposite. Just reverse the logic.
As always, for proper confirmation check to see if they appear on supply and demand zones and/or important historical price levels. If they do then probabilities would be much higher about their reliability.
Use In Trading
The bearish three inside down pattern can occur in a number of different contexts (e.g. at the beginning of a trend, during a trend, at the end of a trend, etc.), but it is most relevant when it occurs during a significant upward trend. 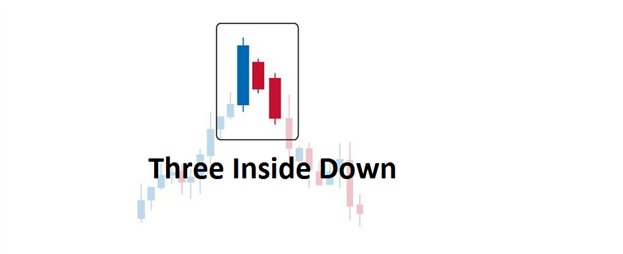 The bearish three inside down pattern is a bearish pattern, and can be used as an indication of the end of an upward trend. The bearish three inside down pattern is a somewhat complicated candlestick pattern, but once the important elements of the pattern are understood (e.g. the third candlestick closing below the open of the first candlestick), the pattern is relatively easy to identify on a price chart, and the pattern can provide a useful indication of upcoming price movement.
See example below from three outside up on GBPUSD daily :
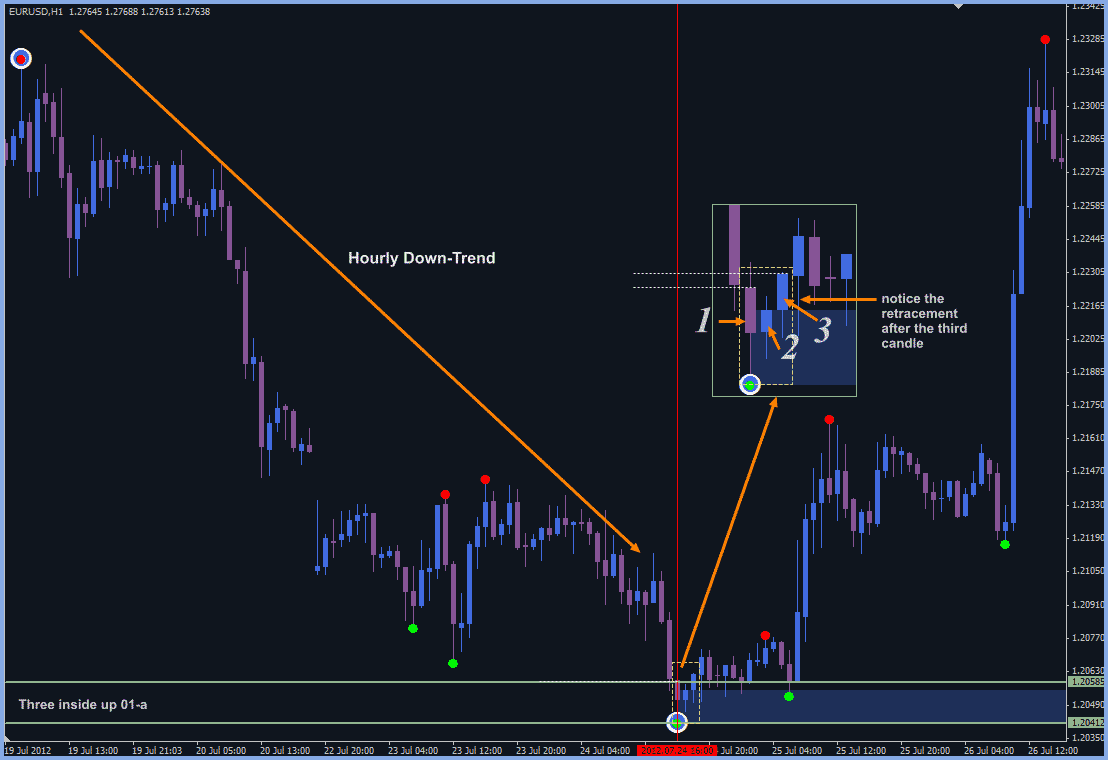
Another example from reversal three inside up candlestick pattern. Lets mark our pattern position and check other time frames to see if find any reference point it’s position.
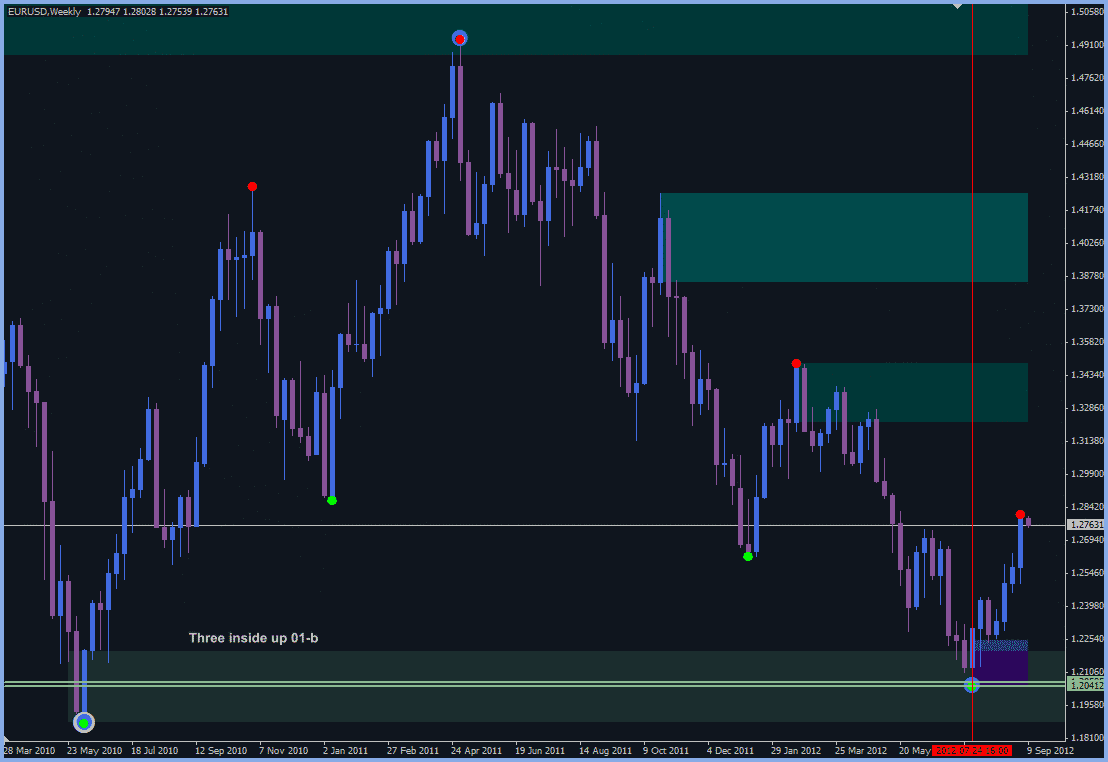
See what we found on weekly. You can see the similar reference on other time frames. I choose the weekly to fit both zones on a same chart. Our pattern established in middle of the weekly demand.
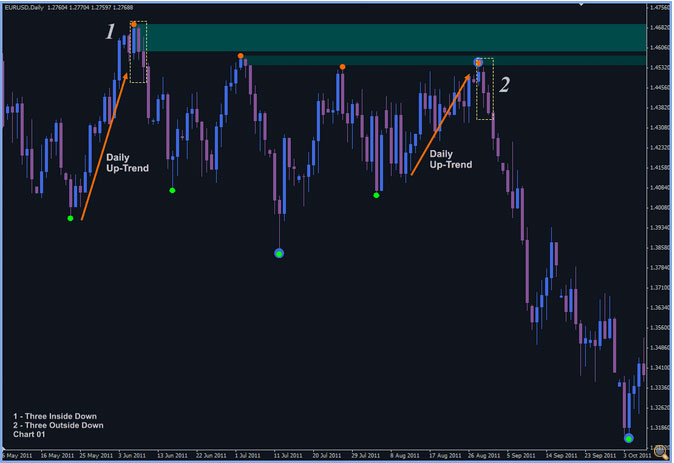
Another Three Inside – Outside Down in eurusd daily, see below :
In the next article, we will share about continuation candlestick patterns from this simplicity of supply demand trading concept.
